Figure 4.

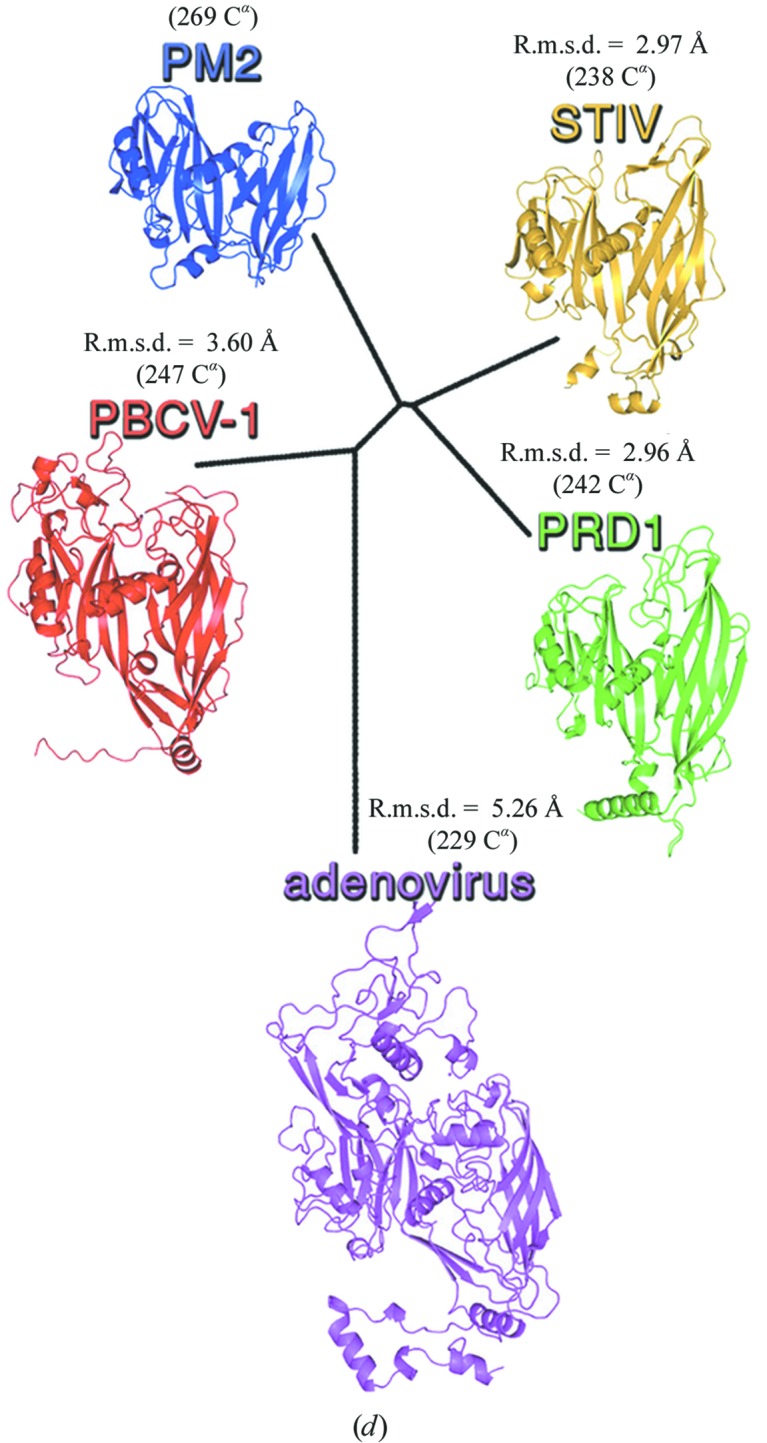
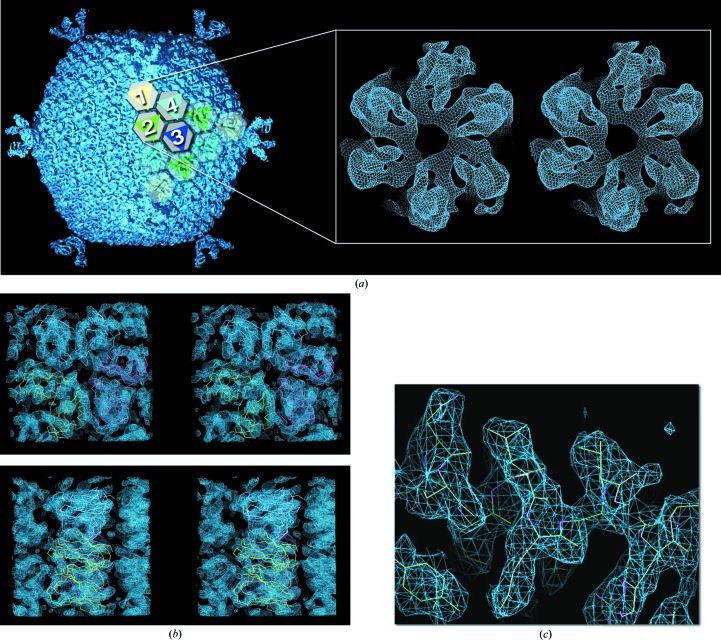
Molecular replacement in the P2 structure determination. (a) Averaged electron-density map (slate blue) for the entire vesicle-containing PM2 bacteriophage at 7 Å, with one triangular facet depicted with grey hexagons, indicating the pseudo-hexameric morphology displayed by the PM2 capsomers, overlaid with coloured triangles (yellow, green, blue and cyan) revealing the trimeric state of MCP P2; one icosahedral asymmetric unit is displayed as solid object and is composed of trimers 1, 2, 3 and 4 but with trimer 3 (blue) sitting on the icosahedral threefold axis, thus with a total of ten P2 subunits. Averaging the density of trimers 1, 2, 3 and 4 led to the electron density for the P2 trimer (inset as a stereoview; adapted from Abrescia et al., 2011 ▶) used as a search model in Phaser (McCoy et al., 2007 ▶). (b) Stereoviews of the electron density (slate blue; contoured at 1.4σ) corresponding to the MR solution obtained by Phaser (for clarity, only one of the two trimers composing the asymmetric unit is displayed). Top, density viewed along the threefold axis (aligned with the cell c axis); bottom, viewed orthogonal to the threefold axis. The Cα double jelly-roll model for the P2 molecules forming the trimer (cyan, yellow and red) used as an envelope for the averaging of the trimers is fitted into density. (c) Close-up of the experimentally phased map at 2.5 Å resolution contoured at ∼1.2σ corresponding to the α-helix spanning residues Asn63–Arg71. Reproduced from Abrescia et al. (2011 ▶). (d) Structure-based phylogenetic tree of the PM2 MCP P2 (blue) with other MCPs (available at the time) of virus members of the PRD1-adenoviral lineage (Abrescia et al., 2012 ▶). The values of the Cα r.m.s.d. between the refined structure of P2 with each MCPs are also shown together with the Cα equivalences (calculated with SHP; Stuart et al., 1979 ▶).

