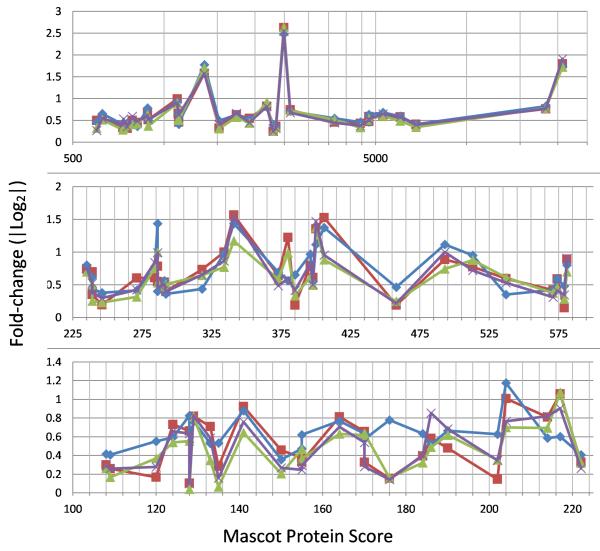
Figure 4.
iTRAQ protein quantitation consensus among four mass spectrometers, relationship of data tightness with decreasing Mascot Protein Score. iTRAQ fold-change ratios scatter increases with decreasing Mascot Protein Score. Red, TripleTOF #1; Blue, TripleTOF #2; Green, LTQ- Orbitrap Velos; Purple, Q Exactive. X axis represent the Mascot Protein Score from TripleTOF #2 for each protein plotted. X axis of panel A is in log. X axis of B and C are linear. Proteins with Mascot Protein Scores >100 and the absolute ratios of cases to control of |log2|>0.35 in fractions 6, 18 and 24 of experiment #2 are plotted.

