Figure 3.

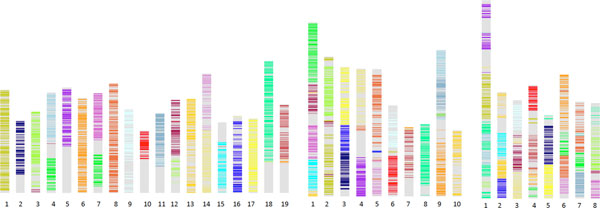
Triplication in three rosid genomes. Chromosomal distribution of triplicated regions in the grapevine, cacao and peach genomes. Colour intensities represent regions with more (darkest) or fewer (lightest) retained genes. Grey areas represent genes that are not in coloured regions.
