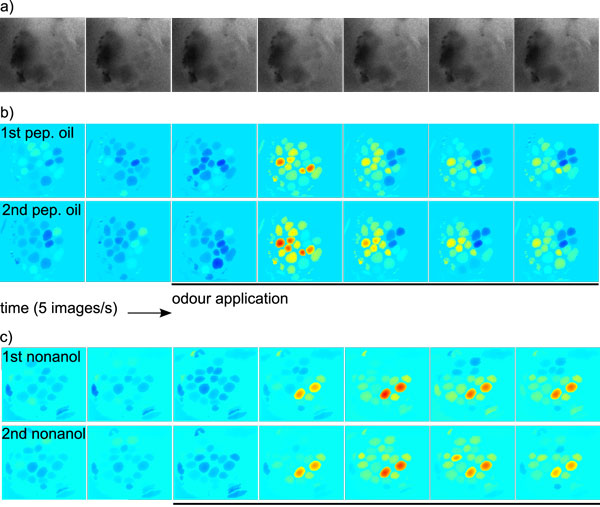
Figure 7.
Evaluation: Biological Data. a) Consecutive images (340 nm/380 nm) from a calcium imaging movie of the honeybee AL. b) Low-rank reconstruction with the method presented in this work. During the interval marked with the black bar, the odour peppermint oil was administered to the bee. The two rows show two responses to the odour peppermint oil measured in the same bee. The images in the first row ("1st. pep. oil") correspond to the raw images in a). Each pixel has been normalised to its mean intensity before odour application. The colour scale is min-max (blue-red) for each row. c) In another bee, responses to the odour nonanol were measured. Data treatment and colour scale as in b).

