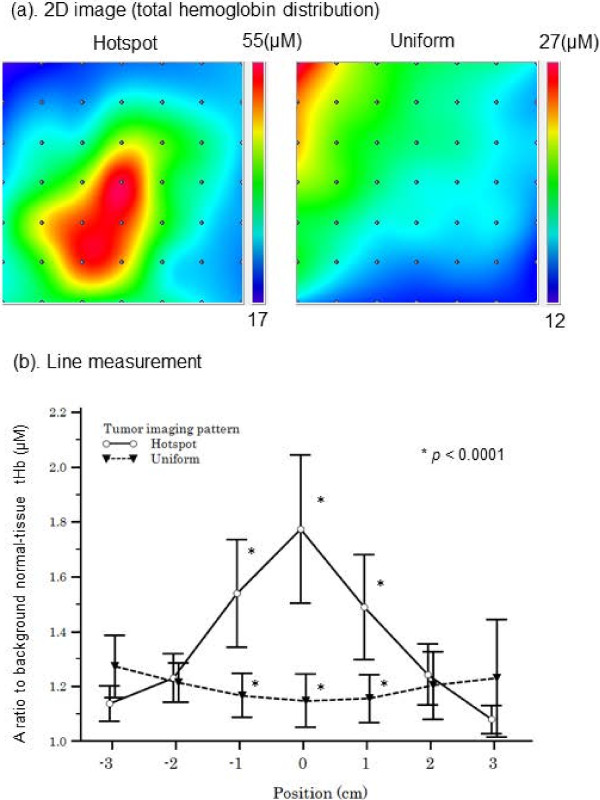
Figure 3.
Optical imaging of tHb level in the breast. (a) A 2D image of the breast total hemoglobin level (tHb) is constructed by applying a spline interpolation algorithm to the raw data. In this example, maps of “hotspot” and “uniform” patterns are shown. (b) A line scan shows that compared with tumors with a “uniform” pattern, tumors with a “hotspot” pattern exhibit a significantly higher ratio of tHb levels to that in the background normal breast tissue.

