Fig. 2.
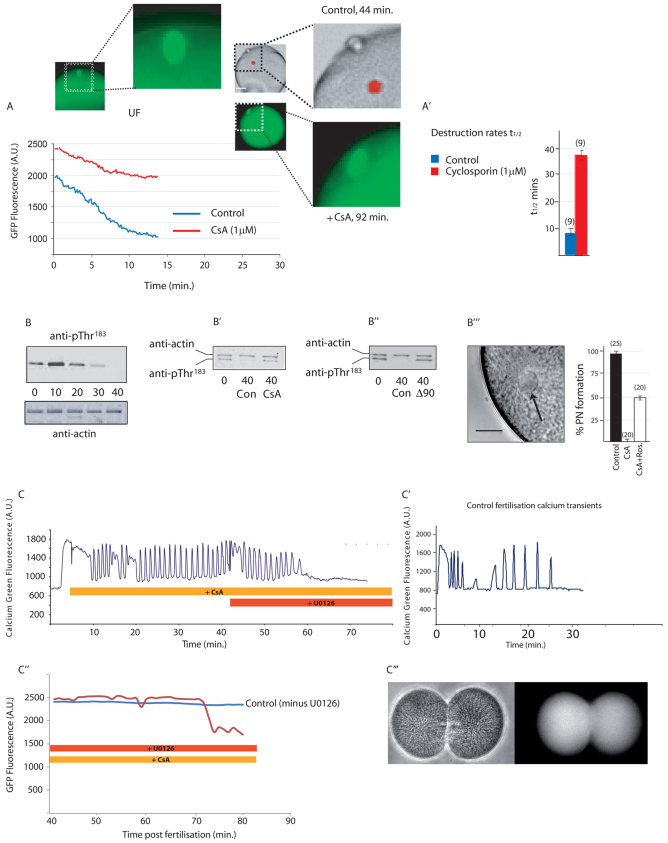
CN activity is necessary for full activation of the APC following activation with calcium. (A) Cyclin B Y170A destruction is impaired by CsA (1 μM) (post-activation time given on x-axis; n=10 from three animals). The spindle (green) remains intact near the egg cortex 92 minutes after activation, whereas by 44 minutes controls have extruded two polar bodies and the chromatin (red) has fully decondensed within a pronucleus. (A′) Analysis of Cyclin B Y170A destruction rates, expressed as mean t1/2 values ±s.e.m. showing that destruction is approximately four times slower in CsA (n in parentheses). (B) Time course of MAPK T183 dephosphorylation at the times shown (in minutes) after fertilisation, showing complete dephosphorylation by 40 minutes (n=3). (B′) T183 remains phosphorylated 40 minutes after fertilisation in the presence of CsA (n=3). (B′) T183 remains phosphorylated 40 minutes after fertilisation in the presence of Δ90 cyclin B (n=3). (B′′) Image shows the pronucleus (arrow) formed after fertilisation in the presence of CsA and roscovitine. Graph shows the percentage of eggs forming pronuclei in the treatments shown [n in parentheses; error bars represent counting error (√n) from one experiment]. (C) Fertilisation-triggered calcium oscillations persist in the presence of CsA but cease ∼15 minutes after U0126 (20 μM) addition (n=4). (C′) Pattern of calcium oscillations in a control egg, ceasing at ∼25 minutes. Time shown represents minutes post-fertilisation. (C′,C′′) Eggs fertilised in CsA and then treated with U0126 after 40 minutes destroy Cyclin B Y170A ∼30 minutes later (C′, red trace) and eventually undergo cytokinesis (n=15/17) as shown in the bright-field (C′′, left) and Map7::GFP (C′′, right) images. All graphs shown are example traces. Scale bars: in A, 20 μm in whole egg images,10 μm in enlarged images; in B′′, 10 μm.

