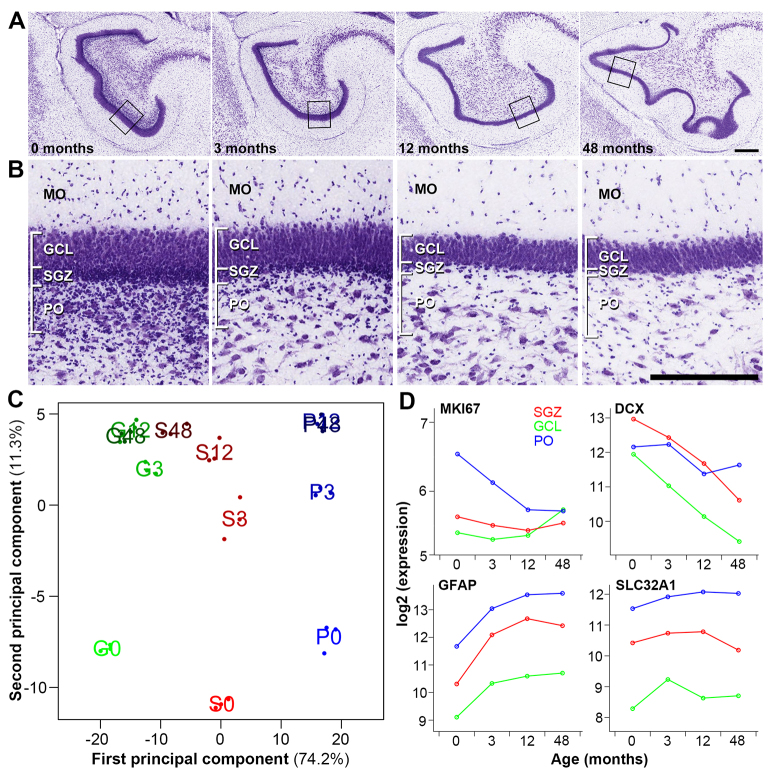
Fig. 4.
Genome-wide analysis of macaque SGZ-enriched genes across postnatal development. (A) Nissl-stained coronal sections of rhesus monkey DG at 0, 3, 12 and 48 months. (B) High magnification images of the DG corresponding to boxed regions in A, showing developmental changes in the appearance and cellular makeup of the DG. MO, molecular layer; GCL, granule cell layer; SGZ, subgranular zone; PO, polymorphic layer. (C) Multidimensional scaling (MDS) plot of the top 388 ANOVA genes (P<10-8). Dots are samples, and text is mean value in group (green G, GCL; red S, SGZ; blue P, polymorphic layer). Percentages indicate the variance explained by the first (x-axis; cell layer) and second (y-axis; age) principal components. (D) Genes marking proliferating cells (MKI67), immature neurons (DCX), astrocytes (GFAP) and interneurons (SLC32A1) show expected spatiotemporal expression patterns across time. Each dot represents the mean expression level of that gene at the labeled age point. Scale bars: 500 μm.

