Fig. 6.
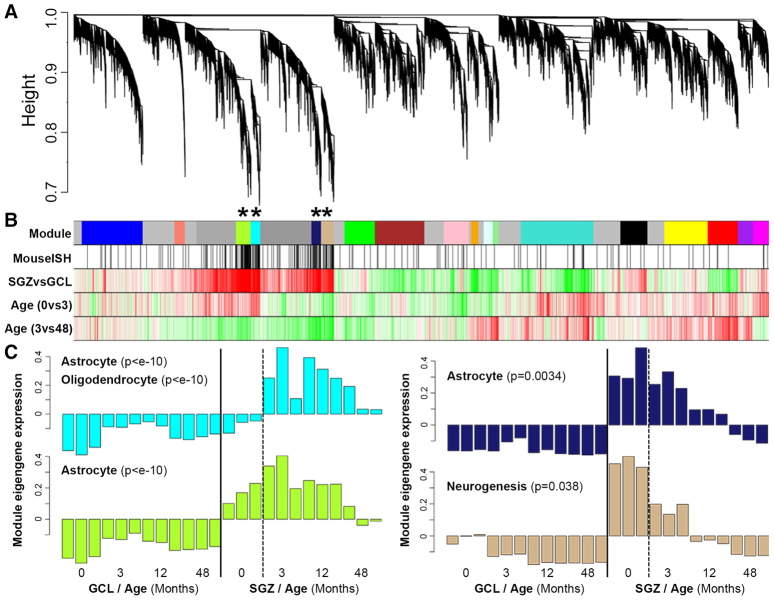
Network analysis distinguishes subclasses of SGZ-enriched genes based on developmental expression profiles. (A) WGCNA cluster dendrogram groups genes into distinct modules. The y-axis corresponds to distance determined by the extent of topological overlap (1-TO). Dynamic tree cutting identified highly parsimonious modules, generally dividing them at significant branch points in the dendrogram. (B) Top color band: Genes in the 18 modules are color-coded. Genes not assigned to a module are labeled gray. Second color band: Genes in mouse SGZ based on ISH are labeled black, and are enriched in the cyan, green-yellow, midnight-blue and tan modules (*P<10-11). Third color band: Plotted t-values of SGZ versus GCL samples, collapsed across all ages. Red corresponds to SGZ-enriched and green to GCL-enriched. Fourth and fifth color bands: Plotted t-values of 0-month versus 3-month, and 3-month versus 48-month samples in SGZ, respectively. Red corresponds to increased and green to decreased expression with age. (C) Module eigengene (ME) expression for the four modules showing SGZ enrichment. y-axes show ME expression (in arbitrary units). Bars represent individual samples (ordered ascending by age). Modules are labeled using selected category enrichments (see supplementary material Table S5 for complete enrichments).

