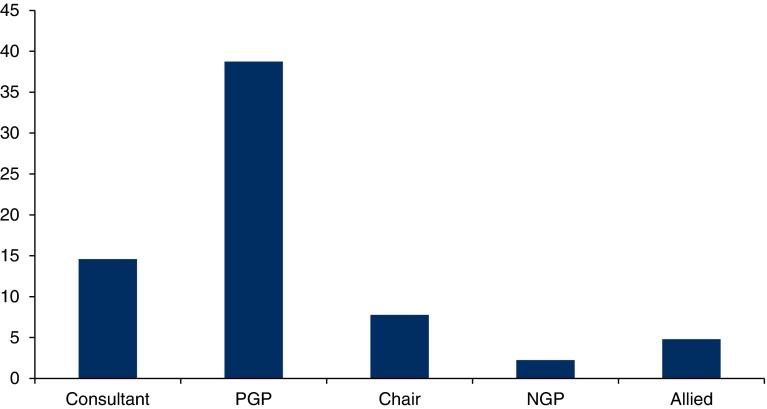
Figure 1.
Distribution of utterances (%) per participant type and MDG (For all MDGs Consultants = 2, PGP = 1, Chair = 1; For MDG 1 NGP = 6, MDG 2 NGP = 4, MDG 3 NGP = 3 and MDG 4 NGP = 4; For MDG 1 Allied = 3, MDG 2 Allied = 3, MDG 3 Allied = 5, MDG 4 Allied = 2). MDG, Multidisciplinary Group; NGP, non-presenting general practitioner.

