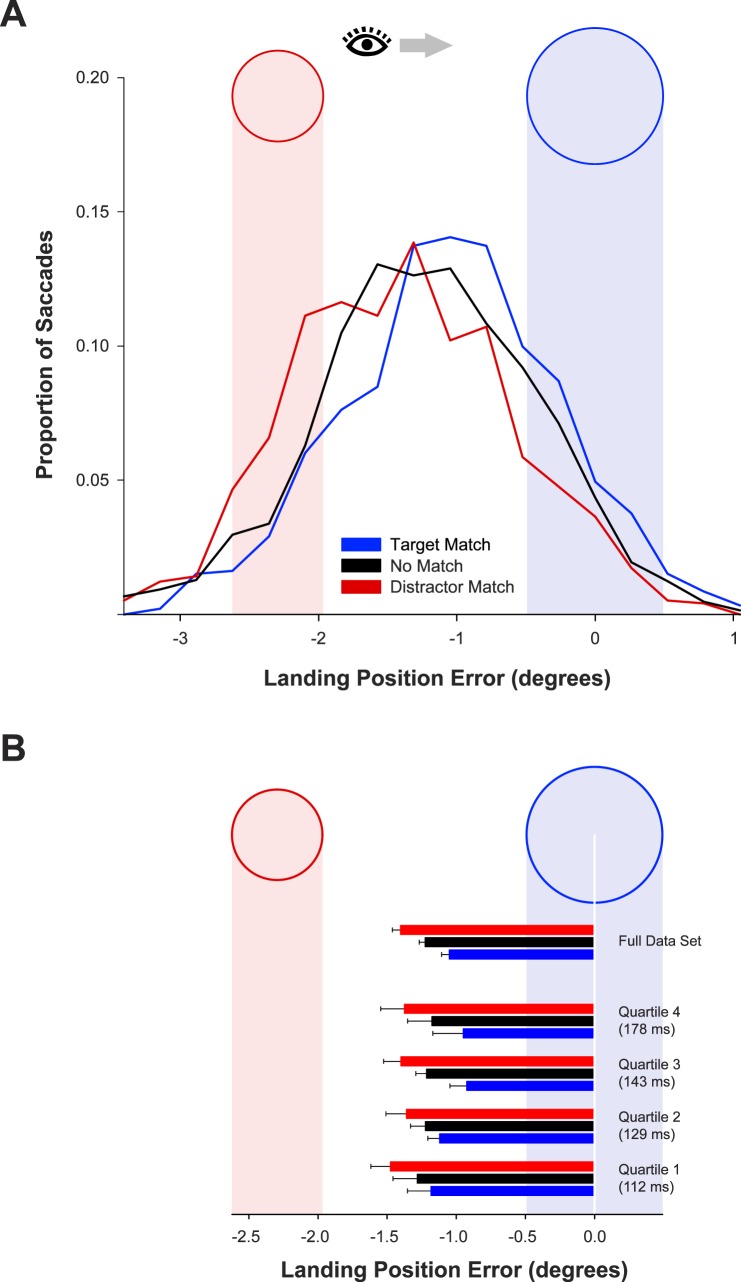
Figure 2.
(A) Distributions of horizontal landing position error (relative to the target center) as a function of memory-match condition in Experiment 1. For this and all subsequent graphs, leftward saccades were normalized for depiction as a rightward saccade. The blue ring and light-blue field illustrate the horizontal location of the target object. The red ring and light-red field illustrate the horizontal location of the distractor. (B) Mean landing position error in Experiment 1 as a function of memory-match condition, for all trials and for trials divided by saccade latency quartile. The end of each bar marks the mean landing position relative to the target and distractor regions depicted in the figure. Error bars are condition-specific, within-subject 95% confidence intervals (Morey, 2008).

