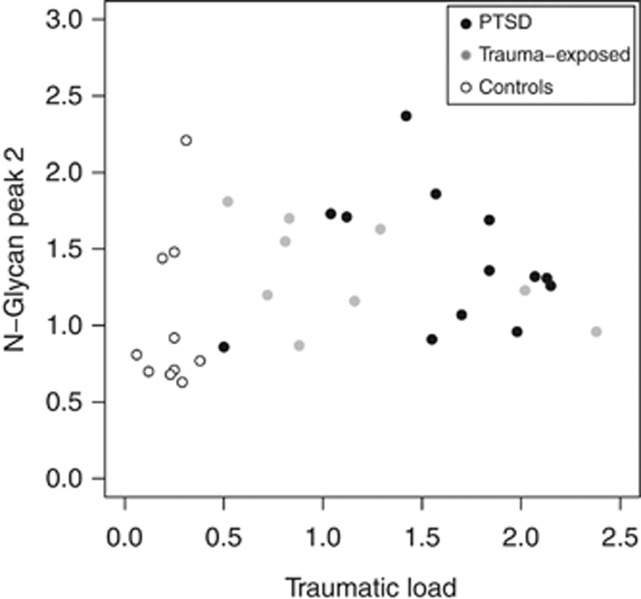
Figure 2.
Scatterplots in the N-glycan peak 2 from n=10 low-stress controls, n=9 trauma-exposed and n=13 PTSD subjects. Individuals with PTSD demonstrated significant higher values in the N-glycan peak 2, compared with low-stress controls. Trauma-exposed individuals were positioned between PTSD and the low-stress control group.

