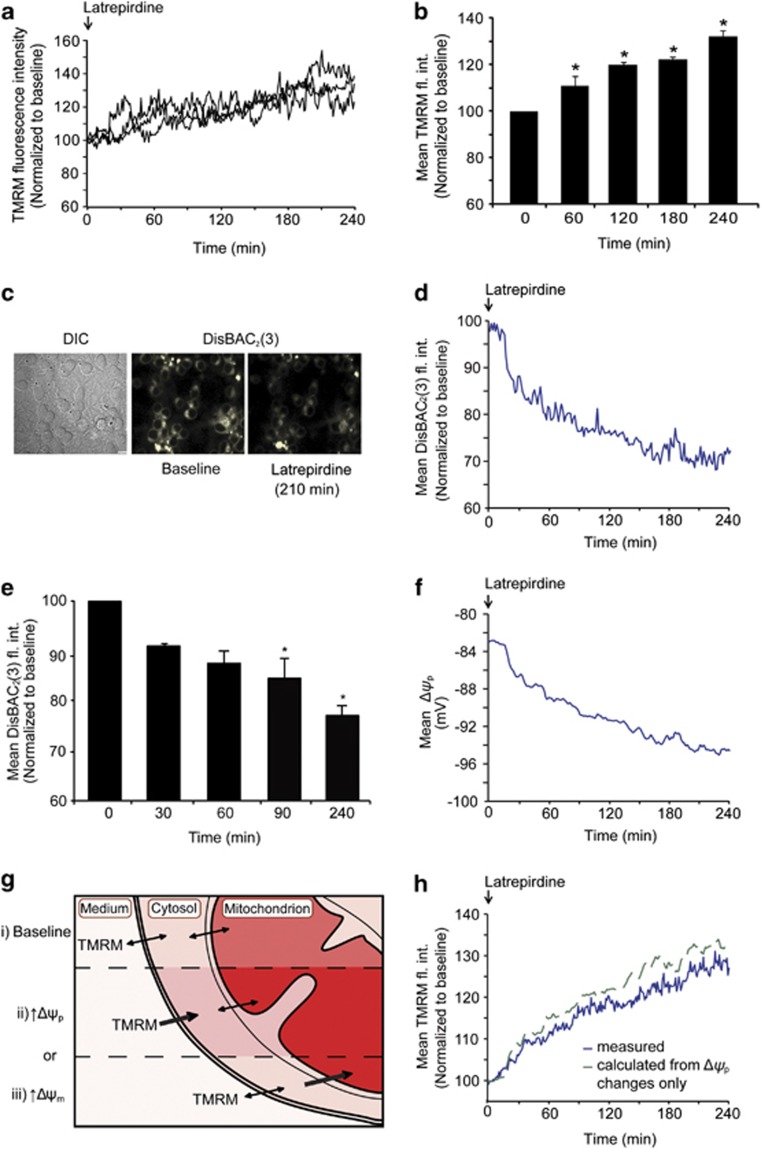
Figure 2.
Latrepirdine increases TMRM fluorescence intensity and hyperpolarizes Δψp. (a) Representative single-cell traces of changes in TMRM fluorescence intensity following latrepirdine treatment. Latrepirdine (0.1 nM) was added to cells on the confocal microscope stage and TMRM fluorescence intensity was imaged at 5-min intervals over 240 min. Analysis was carried out using Metamorph software and average pixel intensity per cell at each timepoint is shown. (b) Quantification of average TMRM fluorescence intensity per cell at selected time points, represented as mean±s.e.m. *P⩽0.05, indicates the difference between 0 min and 60, 120, 240 min after latrepirdine addition (n=65 cells). This experiment was carried out on three independent cultures with similar results obtained. (c) Representative images of CGNs loaded with DisBAC2(3) (1 μM) and treated with latrepirdine (0.1 nM) on a confocal microscope stage showing decreased fluorescence intensity after 210 min. DisBAC2(3) is a bis-barbituric acid oxonol compound that is incorporated into the plasma membrane as a function of Δψp. Plasma membrane hyperpolarization is characterized as an extrusion of the probe with subsequent decrease in fluorescence, whereas depolarization results in increased fluorescence. Scale bar, 10 μm. (d) The DisBAC2(3) traces from 105 cells treated with latrepirdine (0.1 nM) were averaged. Neurons were treated with latrepirdine (0.1 nM) at 0 min and fluorescence intensity imaged at 2-min intervals over 240 min. Image analysis was carried out as described in Supplementary Information. (e) Quantification of DisBAC2(3) (1 μM) fluorescence intensity (fl. int.) in vehicle-treated versus latrepirdine (0.1 nM) treated CGNs from selected time points. Average DisBAC2(3) fluorescence intensity is represented as mean±s.e.m. *P⩽0.001, difference between vehicle-treated and latrepirdine-treated (0.1 nM) neurons stained with DisBAC2(3) (n=105 cells). This experiment was carried out on three independent cultures with similar results obtained. (f) The corresponding Δψp values (in mV) for each timepoint in the mean DisBAC2(3) traces were calculated as described in the Materials and Methods. (g) TMRM fluorescence intensity i) reaches a stable baseline when the dye equilibrates across plasma and mitochondrial membranes and increased fluorescence intensity corresponds to increased uptake driven by either ii) plasma membrane potential (Δψp) hyperpolarization or iii) mitochondrial membrane potential (Δψm) hyperpolarization. (h) The kinetics of the mean TMRM intensity caused by changes in Δψp were calculated according to the Nernstian equilibrium of the TMRM concentrations in the buffer, cytosol and mitochondria (see Materials and Methods for equations). Thereby, it was calculated that the measured TMRM kinetics (blue line) indicated that there was a slight latrepirdine-induced depolarization of the Δψm (−1.6% at 240 min), as the TMRM signal is lower than the expected increase due to the change in cytosolic TMRM after the Δψp hyperpolarization.

