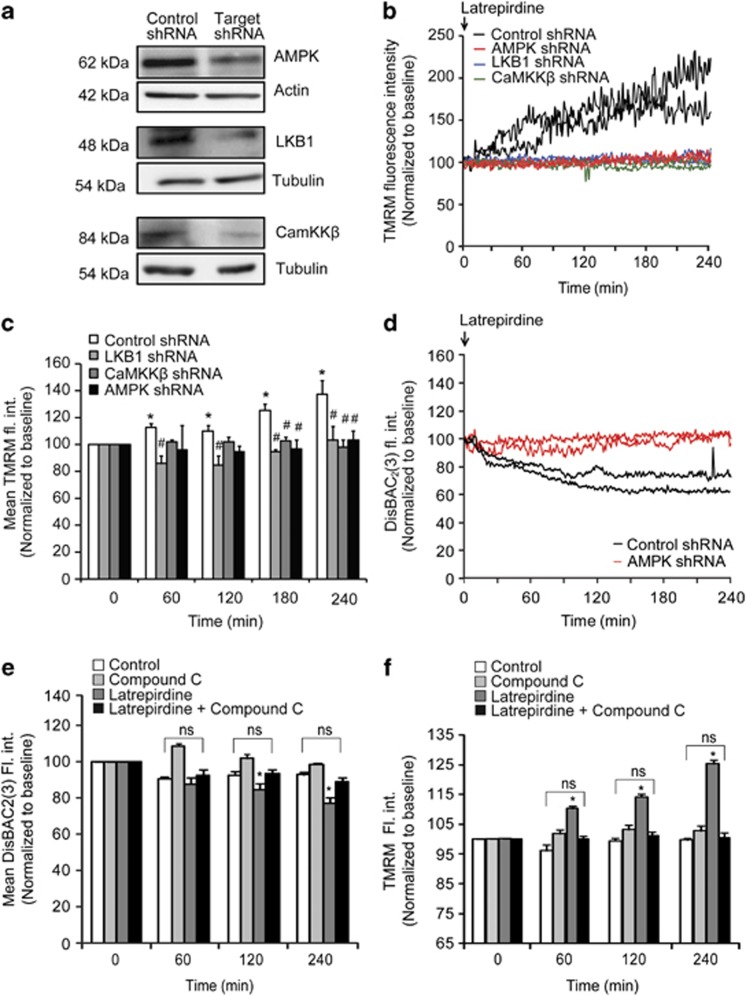
Figure 4.
Inhibition of either AMPK activation or its upstream kinases (LKB1 and CaMKKβ) abolishes the latrepirdine-induced increase in TMRM fluorescence/decrease in DisBAC2(3). (a) Western blot analysis of CGNs transfected with short hairpin RNA (shRNA) directed against AMPK α1/α2, LKB1 or CaMKKβ versus a non-targeting shRNA (control shRNA) in respective experiments. Actin or tubulin served as loading controls. The blots shown are representative of three independent experiments. (b) Representative single-cell traces of changes in TMRM (10 nM) fluorescence intensity following latrepirdine treatment of neurons transfected with control shRNA, AMPKα shRNA, Lkb1 shRNA and CamkB shRNA. Analysis was carried out using Metamorph software and average pixel intensity per cell at each timepoint is shown. Only transfected, GFP-positive neurons were included in the analysis. (c) Quantification of TMRM fluorescence at indicated time points (60, 120, 180 and 240 min) post latrepirdine (0.1 nM) addition for neurons transfected with control shRNA (n=86 cells), AMPKα shRNA (n=47 cells), LKB1 shRNA (n=60 cells) and CaMKKβ shRNA (n=61 cells). Data are shown as mean±s.e.m. *P<0.001 indicates difference between control shRNA in timepoint 0 min versus later time points after latrepirdine addition (60, 120, 180 and 240 min). #P<0.001 indicates difference between control shRNA neurons treated with latrepirdine (0.1 nM) versus neurons transfected with shRNAs directed against AMPK, LKB1 and CaMKKβ treated with latrepirdine. (d) Representative single-cell traces of changes in DisBAC2(3) (preincubated at 1 μM for 30 min at 37 °C) fluorescence intensity following latrepirdine addition (0.1 nM) in neurons transfected with AMPK shRNA versus control shRNA. Analysis was carried out using Metamorph software and average pixel intensity per cell at each timepoint is shown. Fluorescence intensity is represented as mean±s.e.m. *P⩽0.001 compared with group pretreated with vehicle. (e) Quantification of DisBAC2(3) (1 μM) fluorescence intensity (fl. int.) in vehicle-treated (control) versus latrepirdine (0.1 nM)-treated CGNs from selected time points. Average DisBAC2(3) fluorescence intensity is represented as mean±s.e.m. *P⩽0.001, difference between control-treated and latrepirdine-treated (0.1 nM) neurons stained with DisBAC2(3) (n=78 cells). Effect of latrepirdine was abolished in neurons with inhibited AMPK activity (Compound C pretreatment 10 μM) marked as ns. (f) Quantification of TMRM fluorescence at indicated time points (0, 60, 120 and 240 min). Neurons were pretreated with either vehicle (control) or latrepirdine (0.1 nM) ± AMPK inhibitor Compound C (10 μM). Data are shown as mean±s.e.m. *P<0.01 indicates difference between control and latrepirdine-treated neurons. This significance was abolished in neurons with inhibited AMPK activity (Compound C+latrepirdine) marked as ns.

