Figure 5.
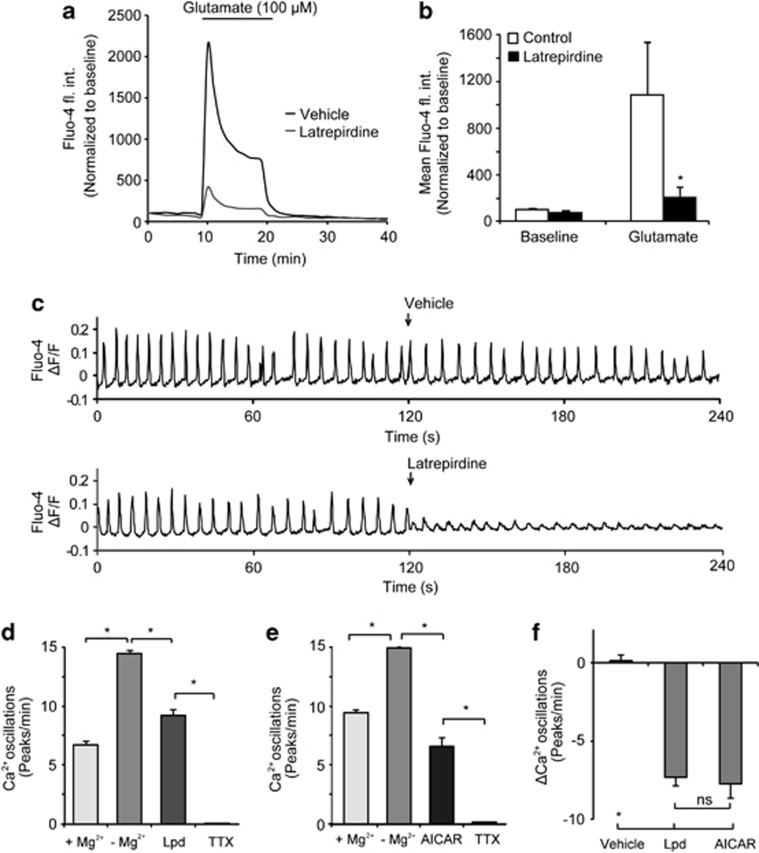
Latrepirdine pretretment attenuates the increase in cytosolic Ca2+ during glutamate excitation and reduces spontaneous Ca2+ oscillations. (a) Average single-cell traces of changes in fluorescence intensity of the cytosolic Ca2+ indicator Fluo-4 AM in response to glutamate excitation. CGNs pretreated with latrepirdine (0.1 nM for 24 h were loaded with Fluo-4 AM (3 μM) and mounted on the confocal microscope stage. Glutamate excitation (glutamate/glycine [100 μM/10 μM] for 10 min immediately followed by addition of MK 801 [2.5 μM]) was induced as indicated. Analysis was carried out using Metamorph software and average pixel intensity per population at each timepoint is shown. (b) Quantification of area under the Fluo-4 AM curve during glutamate excitation in prolonged latrepirdine-pretreated neurons. Vehicle: n=30 cells; latrepirdine: (n=45 cells). Data are shown as mean±s.e.m. *P<0.001 compared with vehicle-pretreated neurons that were glutamate treated. (c) Murine cortical neurons were cultivated on glass bottom dishes, incubated with 5 μM Fluo-4-AM for 45 min at 37 °C, washed, perfused with experimental buffer supplemented with 2 mM MgCl2 and placed on the heated stage of a LSM 5live microscope. Images were taken at 5 Hz, optical slice thickness set to 3.5 μm. The buffer was replaced with MgCl2-free buffer at time 0 and either vehicle or latrepirdine (0.1 nM) was added after 120 s of imaging as indicated. Typical Fluo-4 kinetics are shown as change in fluorescence intensity divided by the mean overall fluorescence intensity (ΔF/F). (d) Quantification of Ca2+ spike frequency after MgCl2 washout, treatment with latrepirdine (0.1 nM, n=176 cells) or (e) AICAR (0.1 mM) (n=88 cells) addition followed by complete block using tetrodotoxin (TTX, 1 μM) (significant difference P<0.05, paired t-test). (f) Quantification of changes of the Ca2+-spiking activity due to addition of latrepirdine, AICAR, or vehicle (Control, n=134 cells, latrepirdine, n=176 cells, AICAR n=88 cells, Kruskal–Wallis and subsequent Mann–Whitney tests showed a significant difference in latrepirdine and AICAR compared with control (*) but no significant difference in latrepirdine compared with AICAR (ns).

