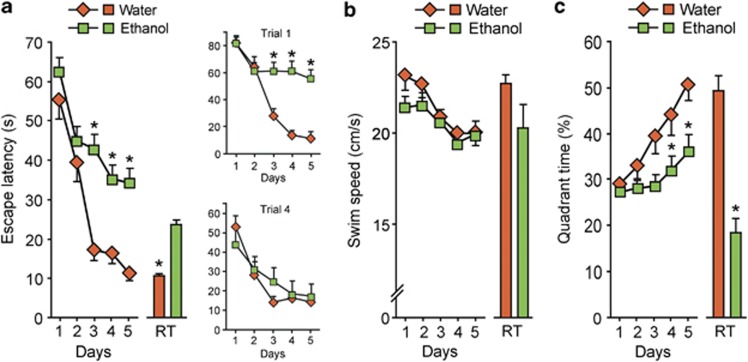
Figure 1.
Effects of ethanol administration on rat performance in the WMT. Rats were treated daily for 6 days with water or ethanol followed by the WMT initiated in 2 days after the last water/ethanol administration. (a) Escape latencies (s); the upper and lower right panels show escape latencies (s) for the first and last daily trials. ANOVA: water, time effect F(4, 888)=10.3, P<0.01; ethanol, treatment × time: F(4, 888)=3.68, P<0.05. (b) Swim speed (cm s−1). ANOVA: ethanol, F(4, 888)=0.77, P=0.42. (c) Time in the platform associated quadrant (% to total time of swimming). ANOVA: water, time effect F(4, 888)=14.6, P<0.01; ethanol, treatment × time: F(4, 888)=2.66, P<0.05. The data for the retention trials (RT) are shown as bar graphs associated with and on the same scale as the acquisition curves. Data are shown as mean±s.e.m. n=42 and 27 rats treated with ethanol and water, respectively. *P<0.05; the Newman–Keuls test was used.

