
Figure 1.
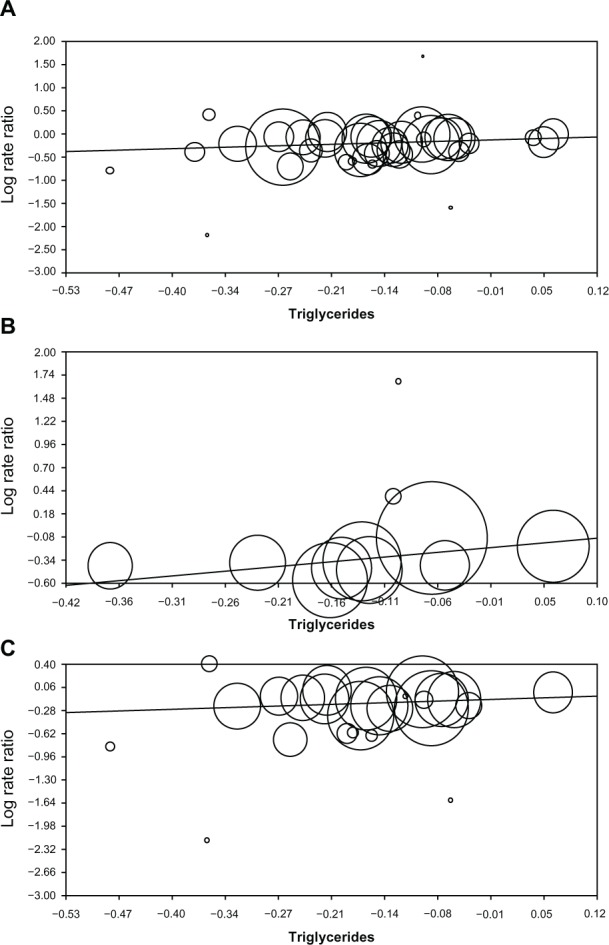
Regression of triglycerides on the log of the rate ratio for (A) all trials, (B) primary prevention trials, and (C) secondary prevention trials. Each panel shows the output from regression analysis in Comprehensive Meta-Analysis.
Notes: (A) 40 trials, slope =0.488, P=0.005; (B) 11 trials, slope =1.031, P=0.010; (C) 25 trials, slope =0.373, P=0.114.