
Fig. 1.
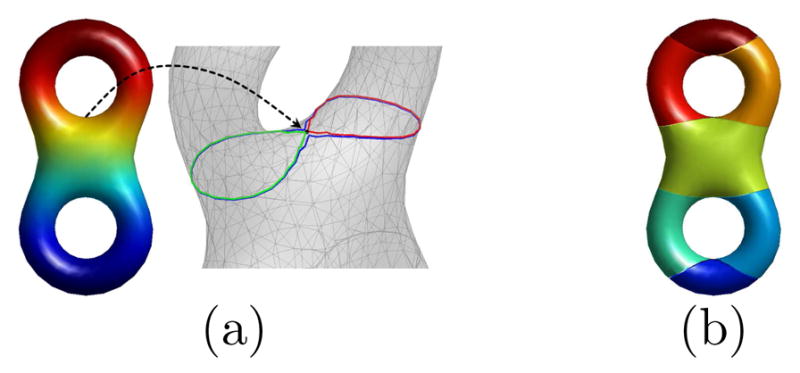
Reeb graph of a LB eigenfunction on a double torus. (a) Level contours in the neighborhood of a saddle point. (b) Edges of the Reeb graph plotted in different colors.
Official websites use .gov
A
.gov website belongs to an official
government organization in the United States.
Secure .gov websites use HTTPS
A lock (
) or https:// means you've safely
connected to the .gov website. Share sensitive
information only on official, secure websites.
Reeb graph of a LB eigenfunction on a double torus. (a) Level contours in the neighborhood of a saddle point. (b) Edges of the Reeb graph plotted in different colors.