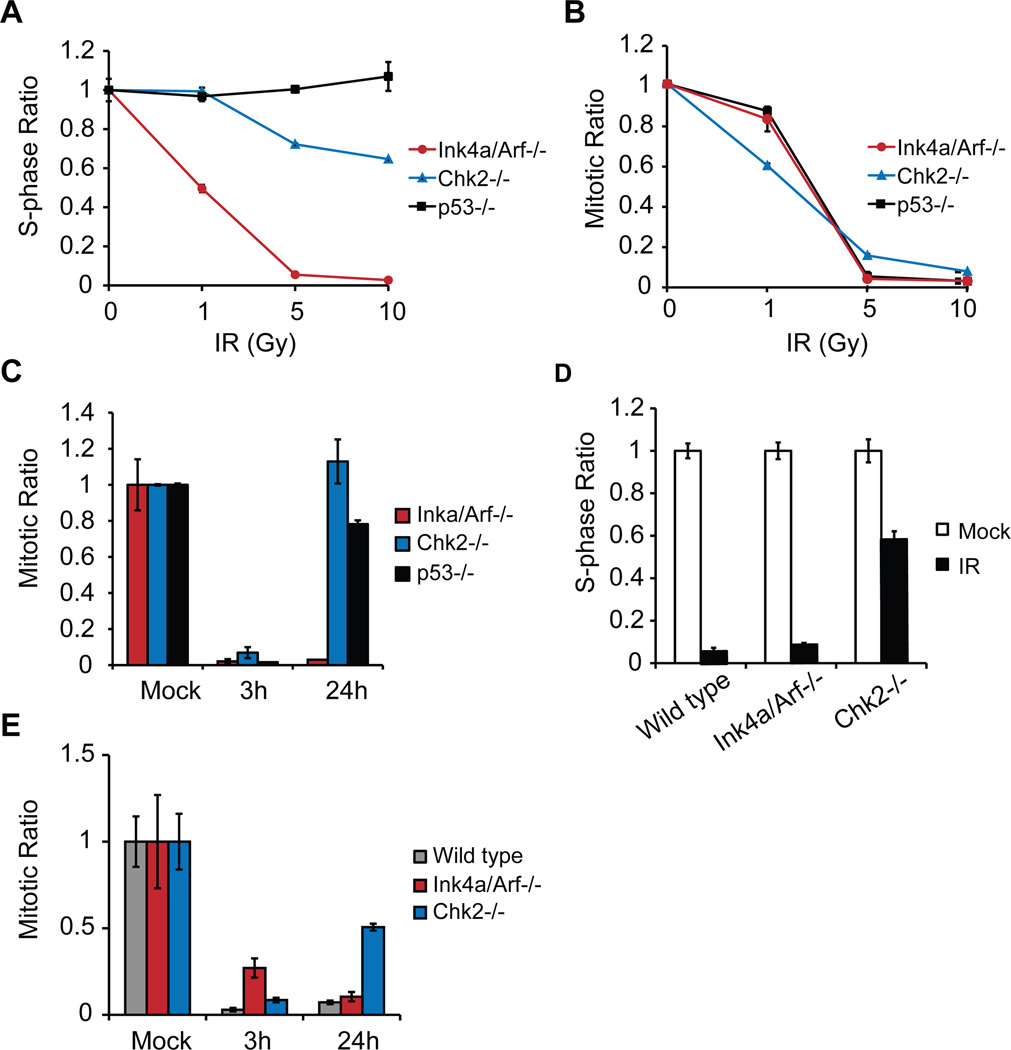
Figure 4. Cell-cycle checkpoints are defective in Chk2 null tumor neurospheres and normal neuronal stem cells (NSC).
(A) The S-phase ratios (%BrdU-positive of treated/average %BrdU-positive untreated) and (B) the mitotic ratios (%pH3-positive of treated /average %pH3-positive untreated) of IR-treated tumor neurospheres (18h and 3h post-treatment, respectively) are plotted. The wedges denote increasing ionizing radiation (IR) doses (0, 1, 5 or 10 Gy). (C) Mitotic ratios of 10 Gy IR-treated tumor neurospheres at the indicated time points. (D) Sphase ratios of mock (white bar) or 10 Gy IR-treated (black bar) NSCs of the indicated genotype. See also figure S2. (E) Mitotic ratios of 10 Gy IR-treated NSCs at the indicated time points. Results are presented as mean ± SD from a representative of two experiments, performed in triplicate.

