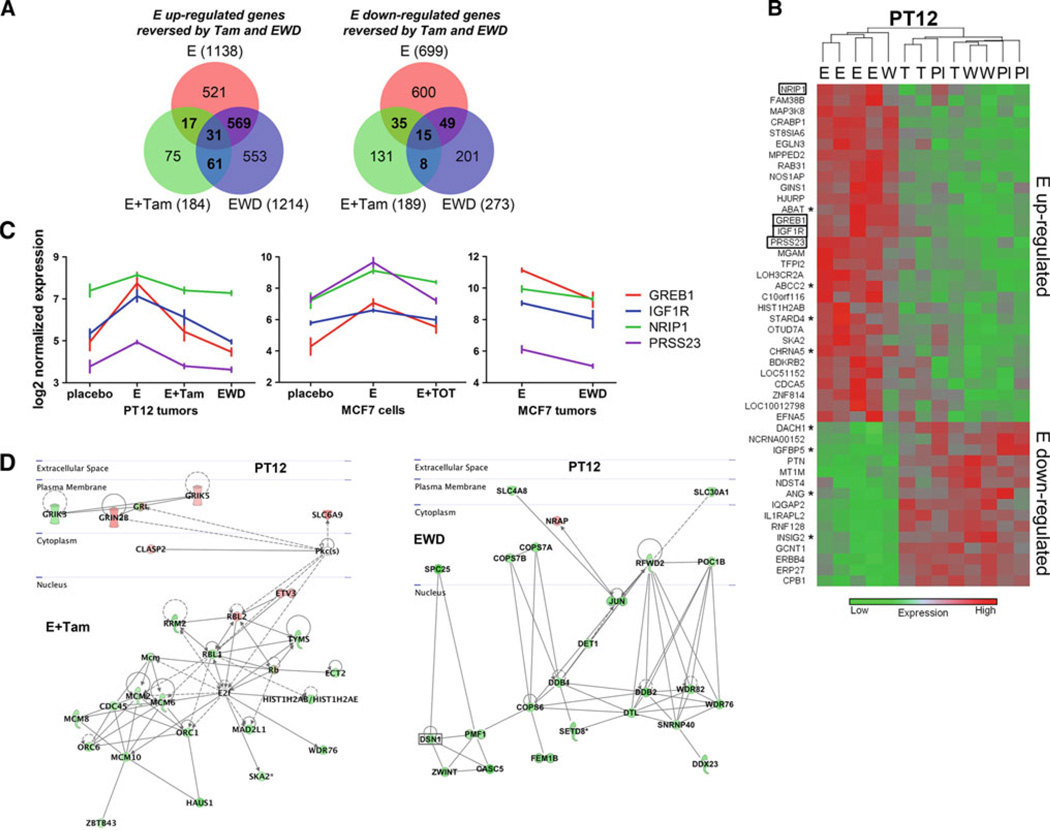
Fig 6.
Gene expression networks in endocrine therapy treated PT12. The gene expression profiles of tumor PT12 grown with continuous estrogen for 8 weeks (E), plus tamoxifen for the last 3 weeks (E + Tam), or EWD for the last 3 weeks, were determined using Affymetrix human gene 1.1 ST arrays. An n of 3 tumors were profiled for all groups except for PT12 E, n of 4. a Venn diagrams comparing estrogen (E) up-regulated genes (compared with placebo) and tamoxifen (E + Tam) and EWD down-regulated genes (compared with E), and E down-regulated genes (compared with placebo) and E + Tam and EWD up-regulated genes (compared with E). b Hierarchical cluster of E up- and down-regulated genes reversed by both endocrine therapies (Pl placebo, T E+ tamoxifen, W EWD). Genes changed in the same direction in MCF7 cells with both tamoxifen and EWD are indicated by boxes and either tamoxifen or EWD are indicated by asterisks. c Normalized expression (log2) plots of four genes that significantly changed in both tamoxifen and EWD PT12 tumors, and tamoxifen-treated MCF7 cells (24 h E vs. 24 h E + 4-hydroxy-tamoxifen [GSE848]), and EWD MCF7 tumors (E vs. 48 h EWD [GSE3834]). d Schematic map based on cellular location of the top significant gene networks altered in tamoxifen (E + Tam) or EWD PT12 tumors

