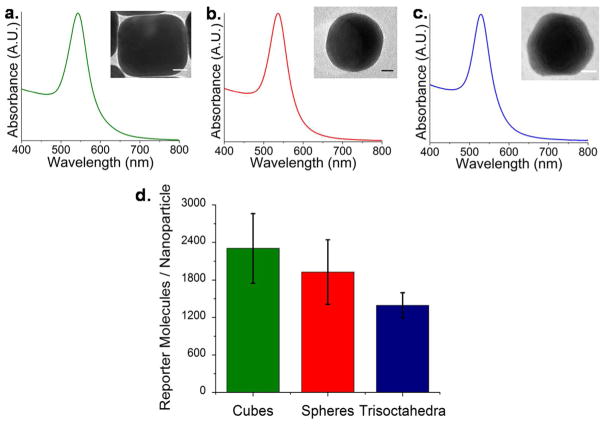
Figure 2.
Normalized electronic absorption spectra of colloidal suspensions of (a) cubes, (b) spheres, and (c) trisoctahedra. Inset: transmission electron micrographs of each shape. Scale bars = 10 nm. (d) Experimental ESI-LC-MS quantification of the average number of methylene blue molecules per gold nanoparticle shape. Error bars indicate the standard deviation over four independently synthesized samples.

