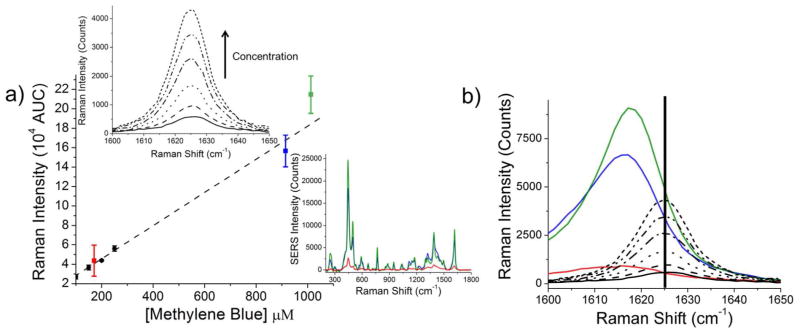
Figure 3.

(a) Spontaneous Raman calibration curve of the ~1625 cm−1 band of methylene blue (black dots), compared to the same concentration of methylene blue bound to gold nanospheres (red square), gold trisoctahedra (blue square) and gold nanocubes (green square). Error bars correspond to the standard deviation of nanoparticle concentration and reporter molecules per nanoparticle as determined by ICP-MS and ESI-LC-MS, respectively. Top left inset: Spontaneous Raman spectra (between 1600 cm−1 and 1650 cm−1) of varying concentrations of methylene blue in water (25 – 400 μM). Bottom right inset: Example spectra calculated from the spontaneous Raman calibration curve with an assumed 0.12 nM gold nanoparticle concentration and 1800 reporter molecules per nanoparticle. (b) Methylene blue molecules experience a conformational change during the trap-coating process, resulting in a slight shift in the observed Raman band. Raman measurements of free methylene blue molecules (vertical bar at 1625 cm−1) versus surface-enhanced trap-coated methylene blue molecules are shown (cubes, green; trisoctahedra, blue; spheres, red).
