
Figure 3. IL-17A neutralization ablated Ang II-induced aortic inflammation and dissection.
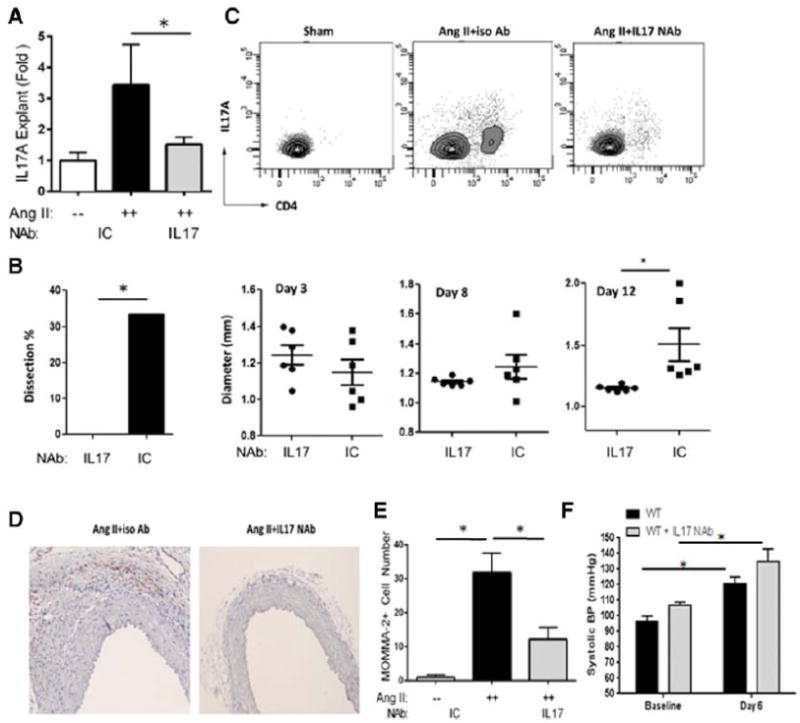
Mice were treated with Ang II and IL-17A NAb or ICAb for 14 d.(A) IL-17A secretion was quantified in aortic explants. White bars: Sham. Black bars: Ang II and ICAb-treated. Grey bars: Ang II and IL-17A NAb-treated. n=4 in each group. *, p<0.05. (B) During Ang II treatment, in vivo imaging of aortas was performed with ultrasonography and maximum diameter of suprarenal aortas was measured. At 14 d, percentage of aortic dissection featured by presence of intramural hematomas was recorded (left panel). Grey bar: animals treated with Ang II and IL-17A NAb, n=13. Black bars: animals treated with Ang II and ICAb, n=12. Right panel, aortic diameter was quantified at d 3, 8 and 12 for each treatment group. Circles: Ang II and IL-17A NAb-treated mice. Squares: Ang II and ICAb-treated mice.*, p<0.05. (C) Flow cytometric analysis of aortic CD4 and IL-17A-positive Th17 cells was performed and number of double-positive cells was measured. n=5 in each group. (D) Aortic sections were immunostained for macrophages using MOMA-2 antibodies. Representative images of each treatment group from 3 different experiments are shown; both images magnified at 200X. (E) Quantification of aortic macrophages for each treatment condition. MOMA-2+ cells were quantified microscopically as cells/visual field at 200x magnification. *, p<0.05. (F) Systolic blood pressure measurements, recorded with tail-cuff plethysmography, were not different between Ang II and IL-17A NAb-treated mice at baseline or at 6 d of Ang II infusion. n=5 mice per group. *, p<0.05.