Figure 3.
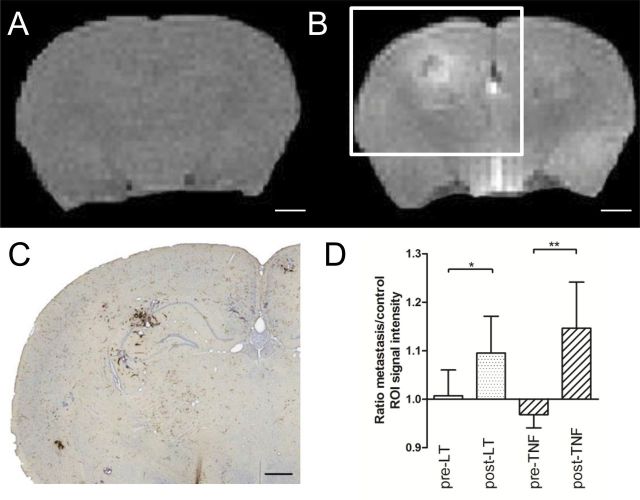
Magnetic resonance imaging detection of cytokine-induced blood–brain barrier (BBB) breakdown. T1-weighted images from tumor necrosis factor (TNF)–treated, metastasis-bearing mouse brain before (A) and 5 minutes after (B) gadolinium-diethylenetriaminepentaacetic acid (Gd-DTPA) injection. Areas of high signal intensity (white) infer areas of BBB breakdown and Gd-DTPA entry. C) Photomicrograph of Hanker–Yates-stained tumor colony from brain slice corresponding to white box in (B). D) Region of interest (ROI; n = 14) signal intensities corresponding to histologically verified metastatic sites in lymphotoxin (LT)– and TNF-treated brains were statistically significantly higher than equivalent control ROIs. Signal intensity of metastasis ROI divided by signal intensity of equal ROI on contralateral hemisphere: ratio of 1.0 represents no breakdown. Wilcoxon signed rank test (two-sided): LT (n = 6; P = .03), TNF (n = 8; P = .008). Scale bars are 1mm (A and B) or 500 μm (C). Statistical analysis: two-sided 1-way analysis of variance with Dunnet post-hoc test vs saline group (*P < .05, **P < .01, ***P < .005). Error bars represent standard deviation.

