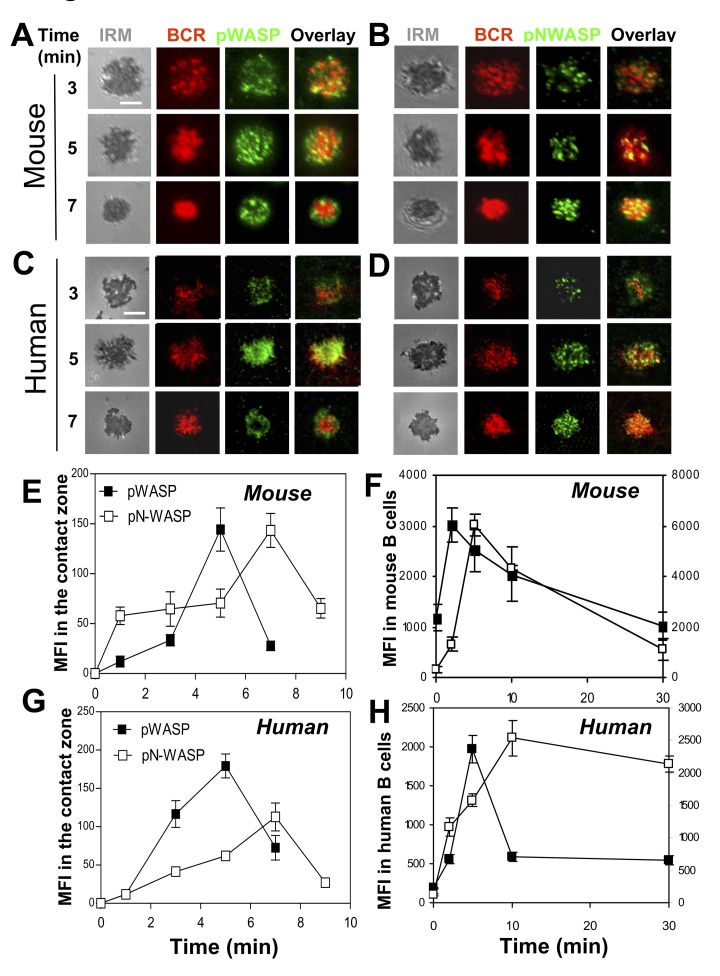
Figure 1. N-WASP is activated following WASP activation upon antigen stimulation.
(A–D) TIRFM and IRM analysis of pWASP and pN-WASP in the B-cell contact zone of mouse splenic B cells and human PBMC B cells that were incubated with membrane-tethered AF546–mB-Fab′–anti-mouse or human IgG+M at 37°C for indicated times. (E and G) The MFI of pWASP or pN-WASP in the B-cell contact zone was quantified using TIRFM images and Andor iQ software. (F and H) The MFI of pWASP or pN-WASP in mouse splenic and human PBMC B cells incubated with soluble Fab′–anti-IgG+M plus streptavidin at 37°C for indicated times were analyzed by flow cytometry. Shown are representative images and the average MFI (±SD) from three independent experiments. Bar, 2.5 µm.

