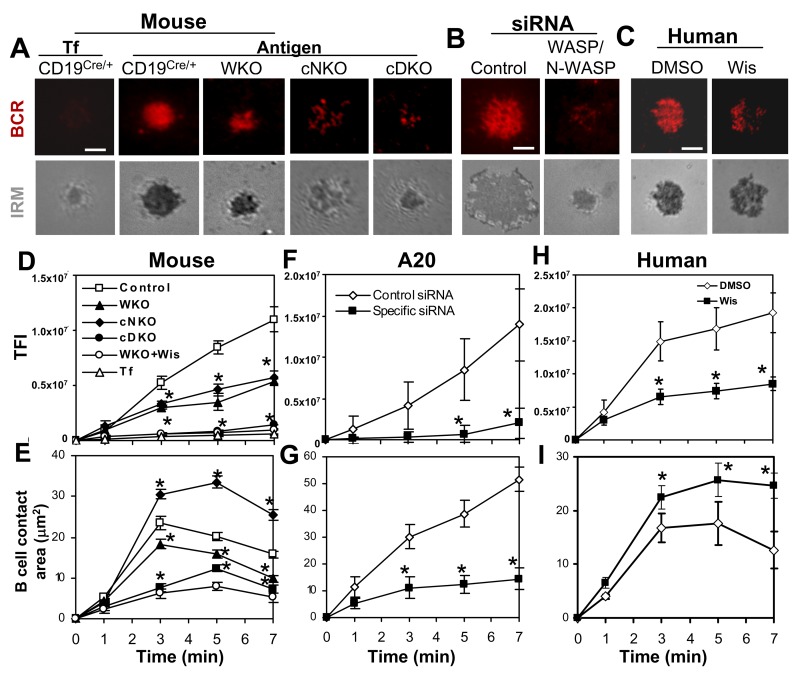
Figure 2. Antigen-induced BCR clustering and B-cell spreading depend on both WASP and N-WASP.
(A–C) TIRFM and IRM analysis of mouse splenic B cells that were incubated with membrane-tethered transferrin (Tf) or Fab′–anti-Ig (A), A20 B cells that were transfected with control or WASP/N-WASP siRNA (B), and human B cells that were pretreated with or without wiskostatin (Wis) and stimulated with membrane-tethered Fab′–anti-Ig (C). Shown are representative images from 7 min. Bar, 2.5 µm. (D–I) The average values (±SD) of the TFI of Fab′–anti-Ig in the B-cell contact zone (D, F, and H) and of the B-cell contact area (E, G, and I) were determined using TIRFM and IRM images from >300 individual cells of 18 mice for each data point including littermate controls (D–E) or of three individual experiments (F–G and H–I). *p<0.01, compared to B cells from littermate control mice, transfected with control siRNA or treated with DMSO.

