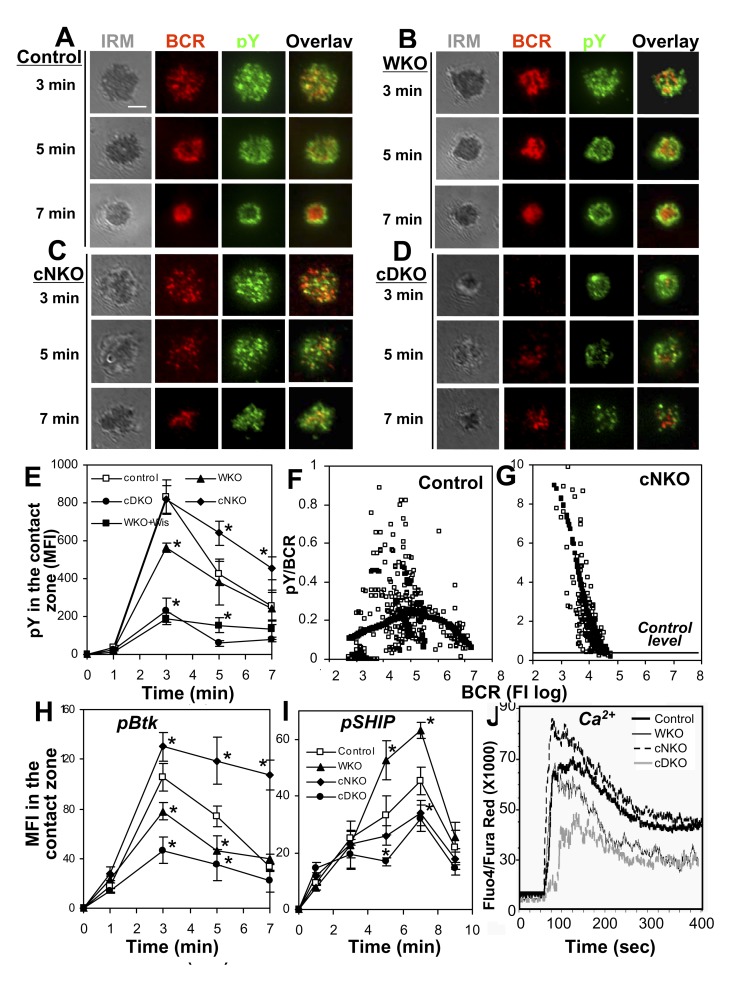
Figure 3. Differential effects of WASP and/or N-WASP KO on BCR signaling.
(A–E) TIRFM and IRM analysis of pY staining in the contact zone of mouse splenic B cells incubated with membrane-tethered Fab′–anti-Ig. Shown are representative images (A–D) and the MFI (±SD) of pY in the B-cell contact zone (E) from three independent experiments. Bars, 2.5 µm. (F and G) The FIRs of pY to the BCR were plotted versus the TFI of the BCR in individual BCR clusters. Each open symbol represents a BCR cluster. The simulated values (solid symbol) were generated by LOSSE nonlinear regression using the Stat software. (H and I) TIRFM analysis of phosphorylated Btk (pBtk) and SHIP-1 (pSHIP) in the contact zone of mouse splenic B cells stimulated with membrane-tethered Fab′–anti-Ig. Shown are the average MFI (±SD) of pBtk and pSHIP in the B-cell contact zone from three independent experiments. *p<0.01, compared to littermate control B cells. (J) Ca2+ flux analysis of splenic B cells activated with soluble mB-Fab′–anti-Ig plus streptavidin using flow cytometry. Shown are representative results from three independent experiments.

