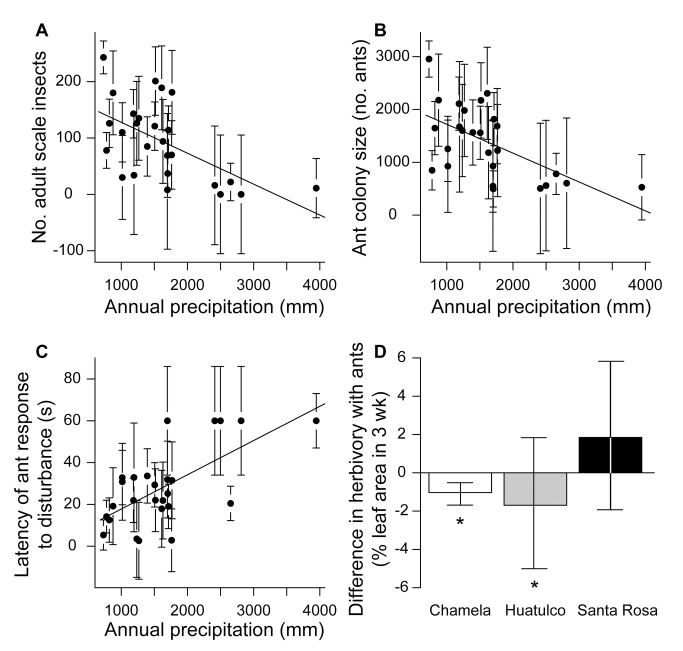
Figure 3. Mutualism strength increases as water availability decreases.
(A) Relationship between annual precipitation of a site and the density of scale insects for all 26 sites (R 2 = 0.31, F 1,24 = 12.15, p<0.002). (B) Relationship between annual precipitation of a site and ant colony size (density of worker ants) for all 26 sites (R 2 = 0.32, F 1,24 = 12.95, p<0.002). (C) Relationship between annual precipitation of a site and the latency of ant response to a standardized disturbance (R 2 = 0.40, F 1,24 = 17.87, p<0.0003). Error bars represent the square root of the total variance across sites divided by the sample size at each site. (D) Difference in percent leaf area eaten between when ants were present and when ants were experimentally excluded at three dry-forest sites along the annual-precipitation gradient from driest (Chamela) to wettest (Santa Rosa). Bars represent mean differences from matched-pair experiments within trees ± SE. Asterisks (*) indicate bars are significantly different from zero by one-sample matched-pair Wilcoxon tests (p<0.04); Chamela, N = 39; Huatulco, N = 27; Santa Rosa, N = 40.

