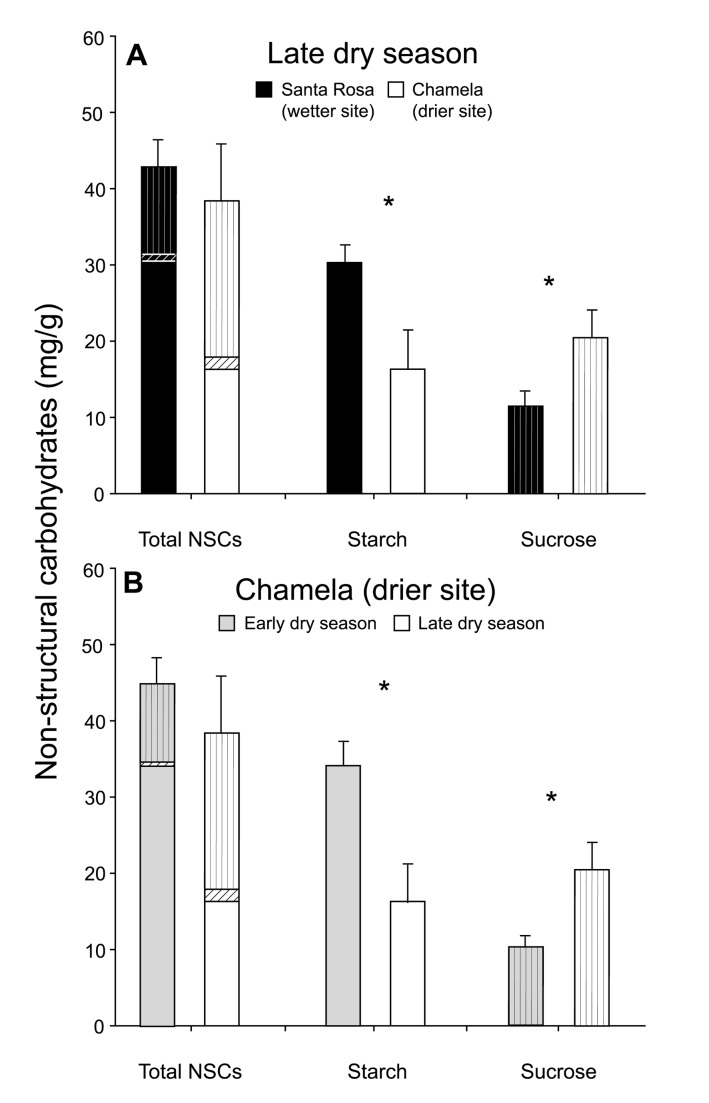
Figure 4. Tree NSC pools and water stress.
Total NSCs, starch and sucrose pools in main stems in (A) the late dry season (April 2009) at a wetter site (Santa Rosa; black bars) and a drier site (Chamela; white bars) and (B) the early dry season (October 2009; gray bars) and the late dry season (April 2009; white bars) at the drier site. Bars indicate means, and error bars indicate SE; values are based on plant dry weights. Starch bars are open, glucose (free sugars) bars have diagonal lines, and sucrose bars have vertical lines. Asterisks (*) indicate p<0.05 by two-tailed t tests.

