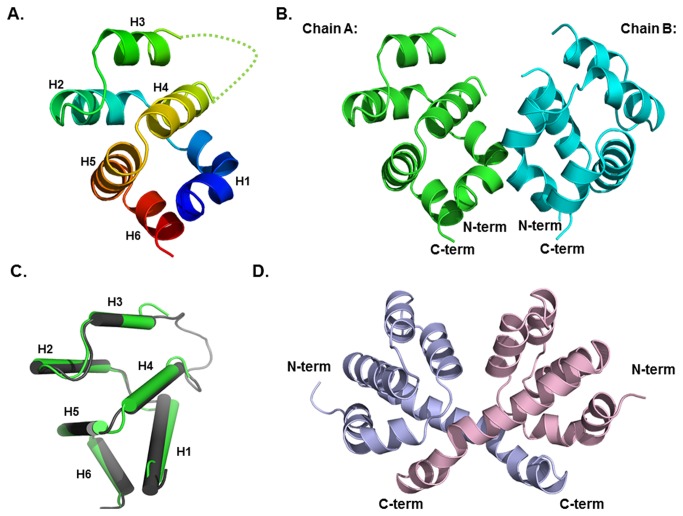
Figure 1. Crystal structure of CARMA1 CARD.
A. Ribbon diagram of CARMA1 CARD. The chain from N- to C-termini is colored by the spectrum from blue to red. Helices from H1 to H6 are labeled. Missing residues are shown as a green dotted-line B. Dimer structure of CARMA1 CARD. Chain A (green color) and Chain B (cyan color) are shown separately. C. Structural comparison between monomeric CARMA1 CARD (colored in gray) and dimeric CARMA1 CARD (colored in green). D. Structure of NOD1 CARD.

