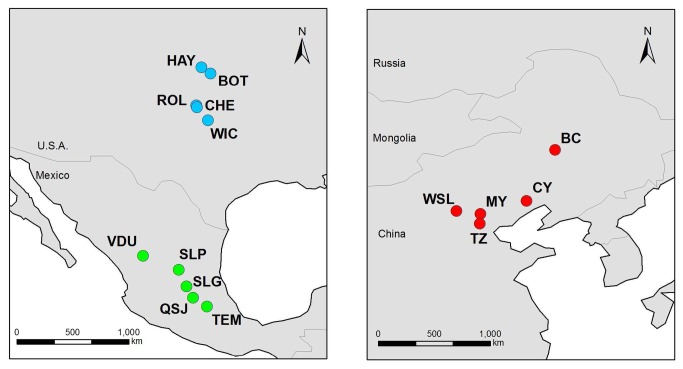
Figure 1. Map showing the location of the 15 sampled populations of Solanum rostratum used in this study.
Left panel: Mexican (native, green circles) and U.S.A. populations from the U.S.A. (residence time >130 years, blue circles). Right panel: Chinese populations (residence time <31 years, red circles). Details of localities and population codes are provided in Table 1.

