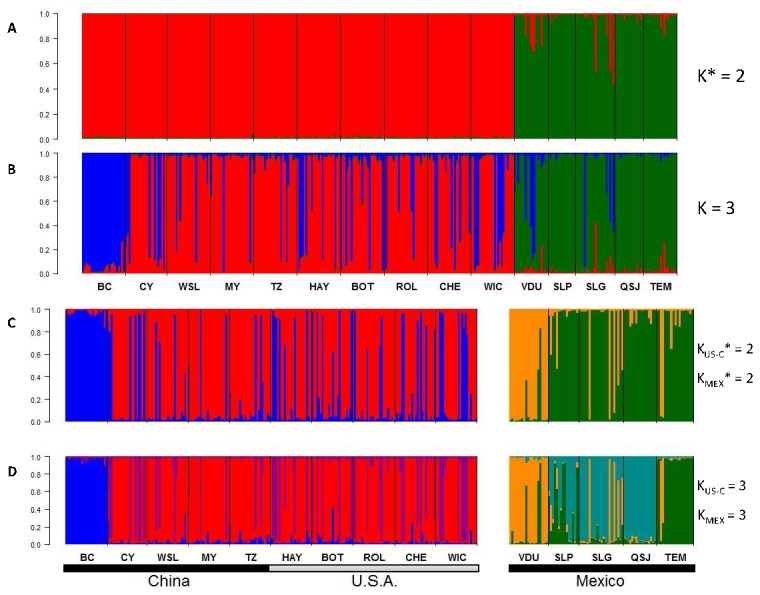
Figure 4. Posterior probability of cluster assignment in nested InStruct analyses of 329 Solanum rostratum individuals genotyped at 10 microsatellite loci across 15 populations in three geographic regions: Mexico, the U.S.A. and China.

Each bar represents a single individual with populations separated by black lines and arranged from North to South within each region. Panel A depicts the uppermost level of population structure across regions. The optimal number of clusters (K* = 2) was calculated using Evanno’s et al. [31] ∆K statistic. For illustration, panel B shows the assignment probabilities for K = 3. Panel C represent two separate analyses of either U.S.A./Chinese or Mexican populations; the optimal number of clusters [31] in each of these separate analyses was K US-C * =K US-C * = 2. Panel D, shows assignment probabilities for K = 3, for each separate analysis.
