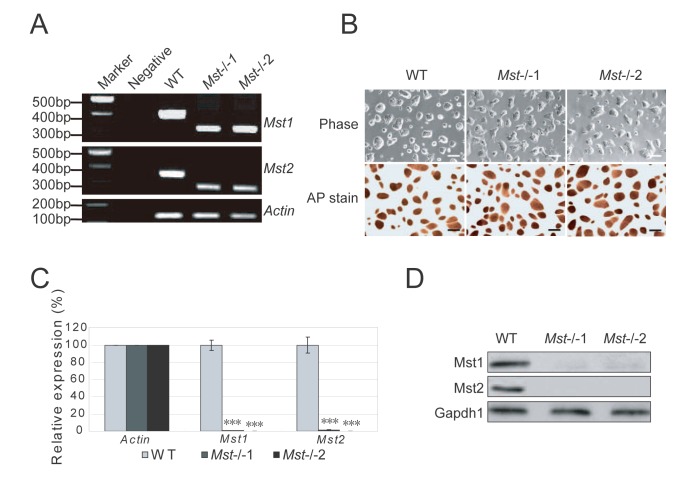
Figure 1. Isolation of Mst-/- ES cells.
(A) Genotyping of wild type (WT) ES cells and Mst-/- ES cells derived from blastocysts by PCR amplification of genomic DNA. Wild type ES cells showed a larger band while Mst-/- ES cells displayed a smaller band. Actin was used as an internal control. (B) Phase contrast microscopy of wild type (WT) and two independent Mst-/- knockout ES cell lines (Mst-/-1 and Mst-/-2) grown on 0.2% gelatin in 2i+LIF medium (Upper). These cells were stained for alkaline phosphatase (Lower). Scale bar, 200 μm. (C) mRNA level of Mst1 and Mst2 in wild type ES cells and Mst-/- ES cells examined by quantitative real-time PCR using primers flanking the deleted region of Mst1 and Mst2. The data are shown as the mean ± S.D (n=3). Actin was normalized as an internal control. Statistically significant differences are indicated (*, P<0.05; **, P<0.01; ***, P<0.001). (D) Immunoblotting analysis of the expression of Mst1 and Mst2 in wild type ES cells and Mst-/- ES cells. Gapdh1 was used as a loading control.

