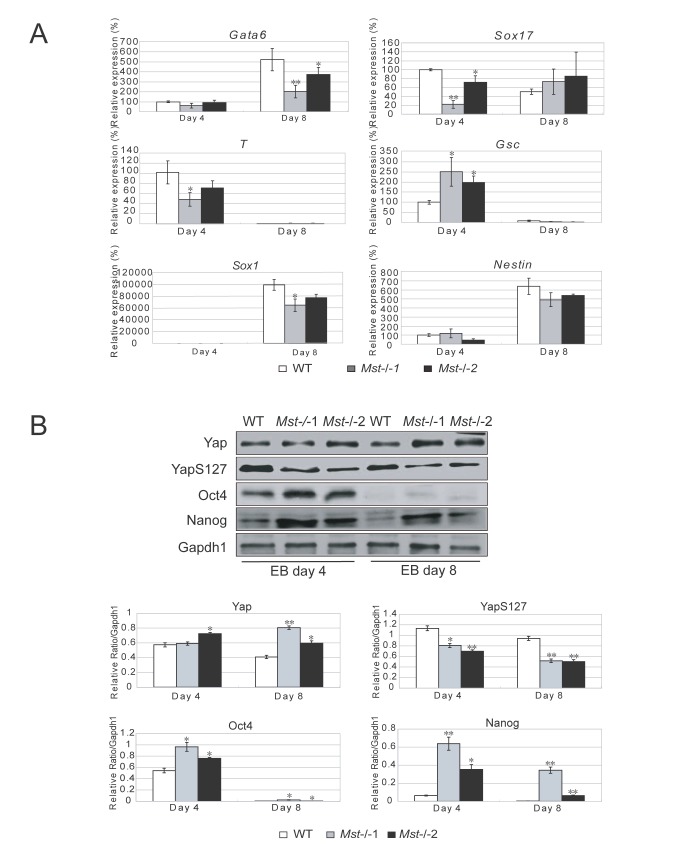
Figure 5. Depletion of Mst1/Mst2 affects proper EB differentiation.
(A) Quantitative real time PCR to reveal the mRNA level of endoderm markers Gata6 and Sox17, mesoderm markers T and Gcs, and ectoderm markers Sox1 and Nestin in wild type EBs and Mst-/- EBs at day 4 and day 8 during EB formation. Actin was analyzed as an internal control. The data were shown as the mean ± S.D (n=3). Statistically significant differences are indicated (*, P<0.05; **, P<0.01; ***, P<0.001). (B) Immunoblotting and densitometric analysis to check the protein level of Yap, YapS127, Oct4 and Nanog in day 4 and day 8 wild type EBs and Mst-/- EBs. Gapdh1 was analyzed as an internal control. The data are shown as the mean ± S.D (n=2). Statistically significant differences are indicated (*, P<0.05; **, P<0.01; ***, P<0.001).

