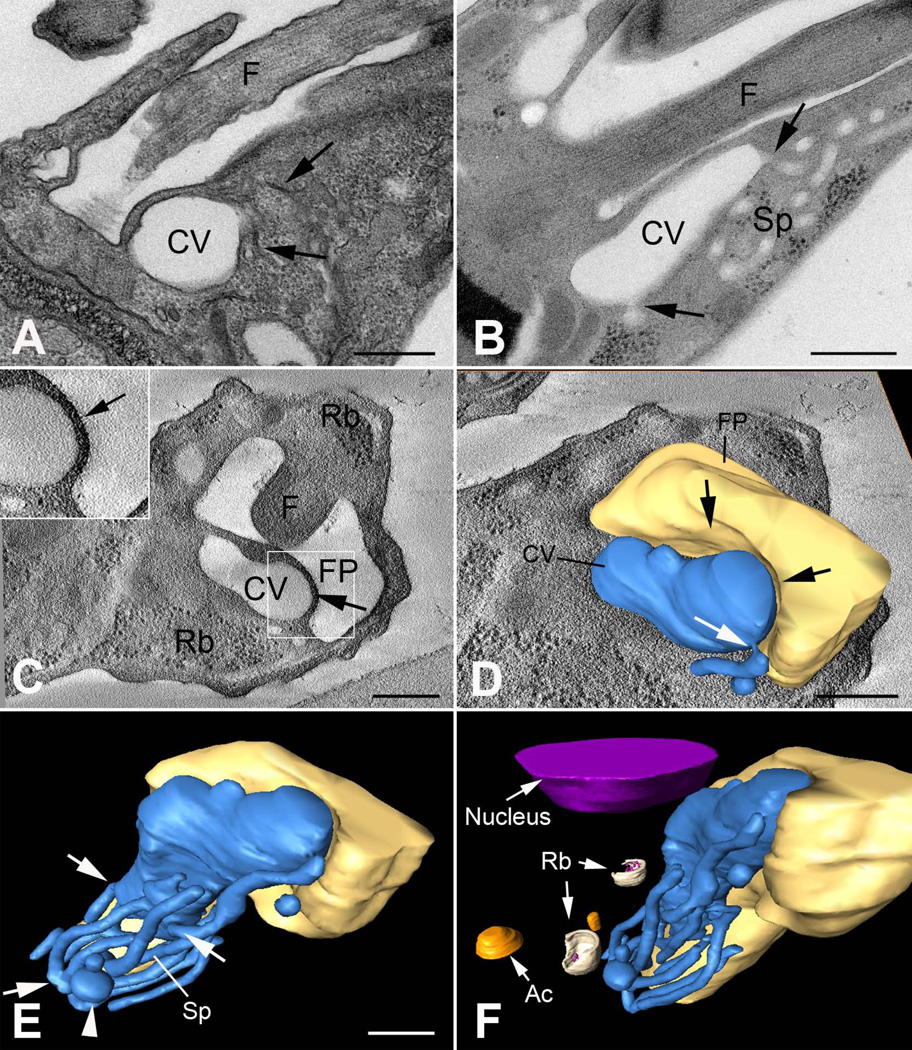
Figure 2. The CVC in T. cruzi epimastigotes.
(A) Thin section of chemically fixed epimastigote showing the CVC. Note the collapsed aspect of the spongiome (arrows). (B) Thin section of a high pressure-freeze substituted epimastigote in the G2 phase of the cell cycle showing the CV and the interconnected tubules (arrows) that form the spongiome (Sp). (C) Virtual section showing the CV docked to the flagellar pocket (FP) and the electron dense region between both structures (arrow and inset). (D) Virtual section and 3D model of the CVC and flagellar pocket (FP) where a deformation in the FP was observed (black arrows) and a tubule of the spongiome was connected to the central vacuole (white arrow). (E) 3D model of the CVC and FP showing the interconnected spongiome connected to the CV (arrows) and concentrated in the anterior region of the CV. Some vesicles were also connected to the spongiome (arrowhead). (F) 3D model showing the organization of the CVC and surrounding structures, such as ribosomes (Rb), acidocalcisomes (Ac) and nucleus. Scale bars = 200 nm. Reproduced with kind permission from ©Springer Science+Business Media, from from Fig. 5 of (Girard-Dias et al., 2012).

