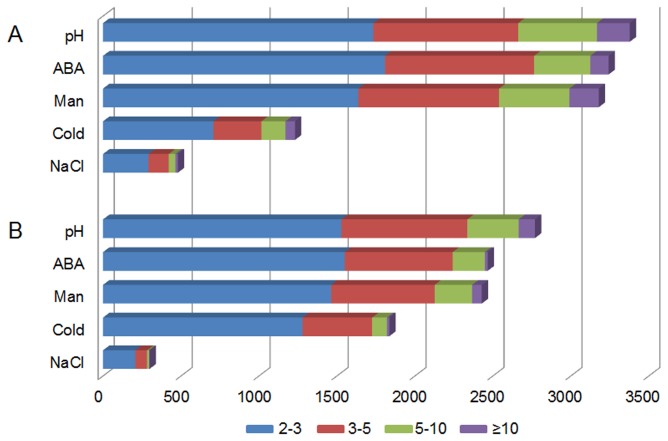
Figure 1. Number and the level of transcripts identified as differentially expressed in cotton seedlings under abiotic stress conditions.
The y-axis indicates the treatment of different stress. pH, pH=11; ABA, 1μM ABA; Man, 200mM mannitol; Cold, 4°C; NaCl, 200mM NaCl. The x-axis indicates the number of differentially expressed genes (DEGs), the columns with different color show the fold change of corresponding DEGs. A. up-regulated; B. down-regulated.

