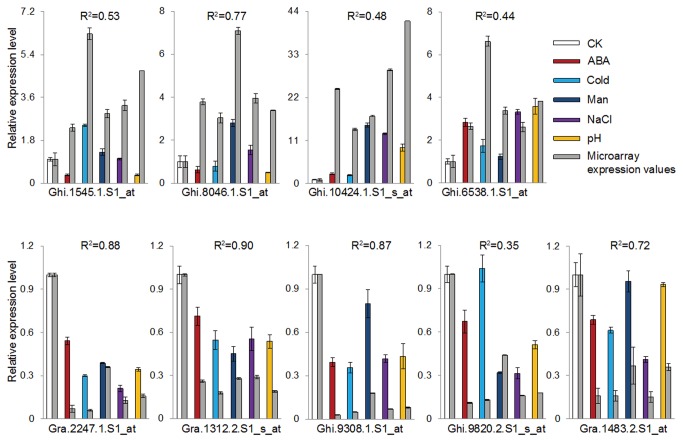
Figure 4. Quantitative real-time PCR validation for selected transcripts.
The columns indicate the qRT-PCR values of CK (white bar), ABA (red bar), Cold (light blue bar), Man (dark blue bar), NaCl (purple bar) and pH (yellow bar), respectively. The columns (grey bar) indicate the relative microarray expression value of crossponding stress treatment. CK, control plants; pH, pH=11; ABA, 1μM ABA; Man, 200mM mannitol; Cold, 4°C; NaCl, 200mM NaCl.

