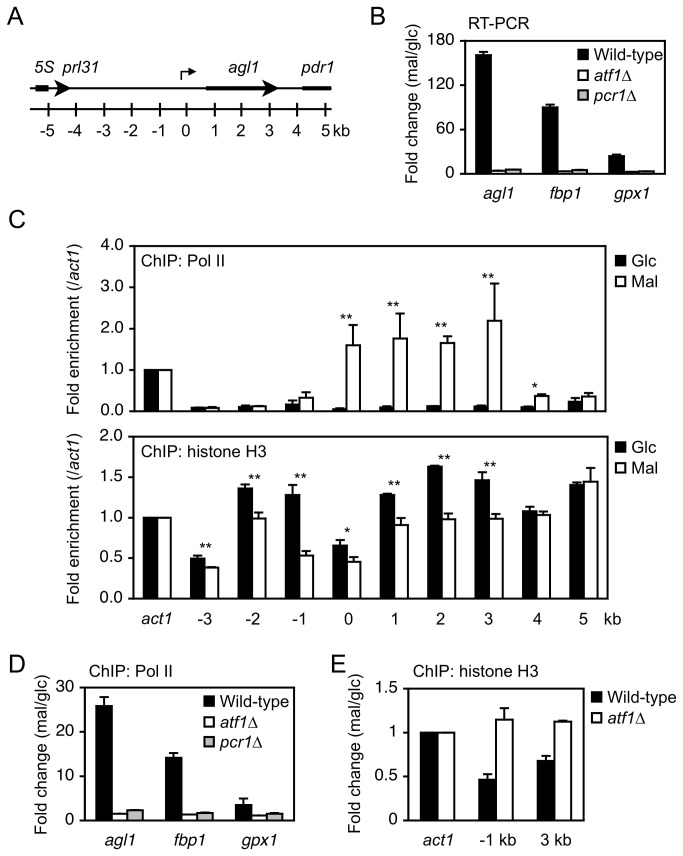
Figure 3. Atf1 and Pcr1 positively regulate the expression of Agl1 at the transcriptional level.
(A) Schematic representation of the agl1 locus. Positions relative to the transcriptional start site of agl1 are indicated. (B) Atf1 and Pcr1 are required to increase the mRNA level of agl1. Cells of the indicated strains exponentially growing in YE were washed twice, resuspended in YE or YEM, and incubated at 30°C for 2 hours. Total RNA was used for RT-PCR analysis. Expression levels of the indicated genes relative to the level of the constitutive act1 gene in the indicated strains grown in maltose-containing medium. The fold change compared to levels in cells grown in glucose-containing medium is shown. (C) RNA polymerase II and histone H3 occupancy of agl1 before and after the carbon source change. Wild-type cells cultured as described in (B) were used for ChIP analysis. The levels of RNA polymerase II and histone H3 at target regions of agl1 that are presented in (A) were normalized against their levels at act1. Glc: glucose; Mal: maltose; Pol II: RNA polymerase II. *P<0.05, **P<0.01 (Student's t-test). (D) The increased RNA polymerase II occupancy at agl1 depends on Atf1 and Pcr1. Cells of the indicated strains were cultured as described in (B) and then used for ChIP analysis of RNA polymerase II. Levels of RNA polymerase II associated with the indicated genes relative to the level associated with act1 in cells grown in maltose-containing medium. The fold change compared to levels in cells grown in glucose-containing medium is shown. (E) The decreased histone H3 occupancy at agl1 depends on Atf1. Cells of the indicated strains were cultured as described in (B) and then used for ChIP analysis of histone H3 as described in (D). Error bars, s.d. (n=3).

