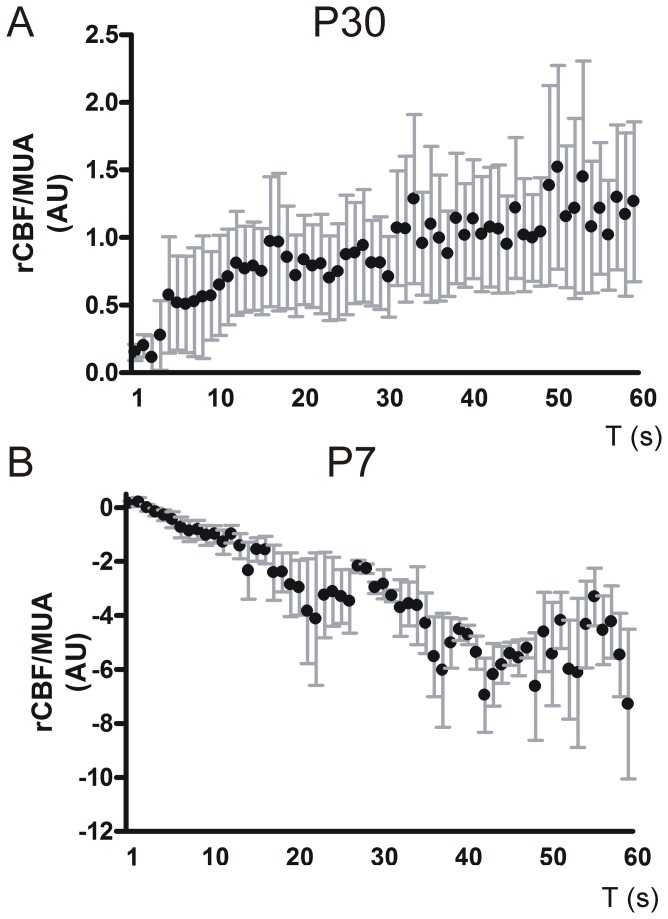
Figure 7. Correlation of rCBF/MUA ratio and stimulation time.
rCBF values were correlated to corresponding MUA and were plotted against stimulation time in arbitrary units (AU). rCBF per MUA increases over stimulation in P30 mice and is significantly positively correlated with stimulation duration (A). In contrast rCBF decreased per MUA over stimulation time in P7 mice. Here the correlation coefficient was negatively correlated (B). Error bars indicate + SEM.

