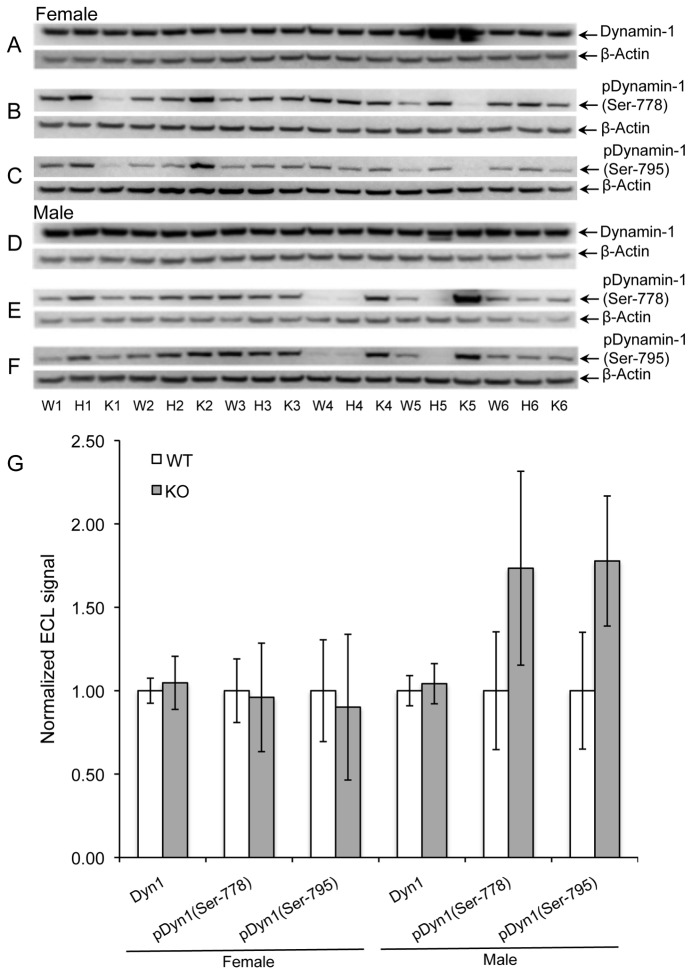
Figure 4. Phosphorylation of dynamin-1 at Ser-778 and Ser-795.
Panels A-C show Western blots of brain extracts from female mice for dynamin-1 (A), phosphorylation of dynamin-1 at Ser-778 (B), and phosphorylation of dynamin-1 at Ser-795 (C). Panels D-F: Same as with A-C for male mice. Panel G: Quantitative measurements of band intensities after normalization to β-actin. Data are expressed as means ± SEM (n=5 for each genotype) with statistics as in Figure 1. None of the tests showed a significant difference.

