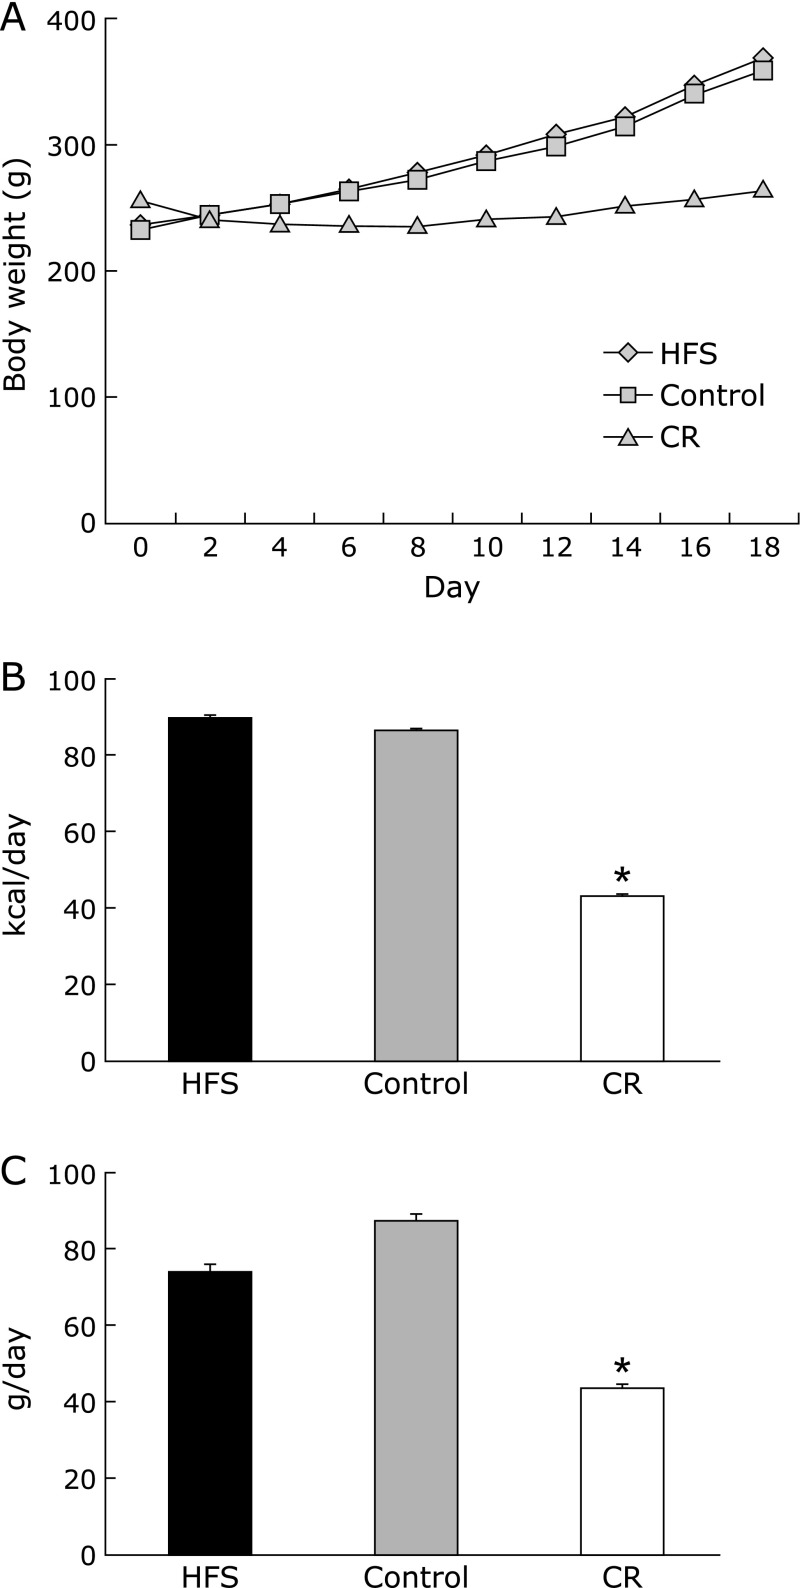
Fig. 1.
Changes in body weight, daily energy intake and food intake of dams during dietary intervention. (A) Body weight was measured every other day. (B) Daily energy intake was calculated from recorded daily food intake. (C) Daily food intake was recorded during dietary intervention from mating to delivery. HFS, isocaloric high fat and sucrose diet; control, control AIN93G diet; CR, calorie restriction diet (50% of control diet). Data are mean ± SEM. *p<0.05 vs control.

