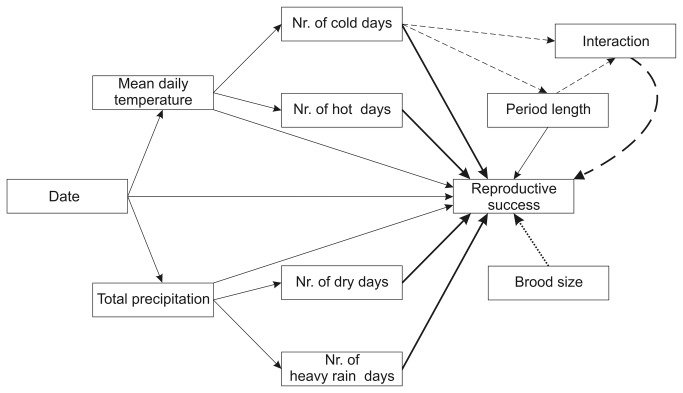
Figure 1. Model structure in SEM analyses.
Thin lines stand for effects included in all models, thick lines for relationships that varied within model sets, dashed lines for paths contained only in the model set of hatching success, and the dotted line for the effect of brood size in model sets of nestlings’ body mass and tarsus length.

