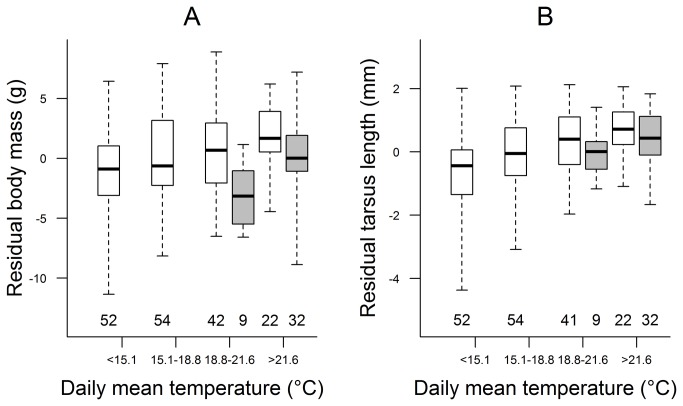
Figure 4. Relationship of nestlings' body size with average daily mean temperature and number of hot days.
For illustrative purposes, daily mean temperature was categorized according to its 25%, 50% and 75% percentiles. The number of hot days was dichotomized as few (≤2; white boxes) and many (>2; grey boxes) as the median was zero and the 75% percentile was 2 hot days. Body mass (A) was controlled for date and age of nestings, whereas tarsus length (B) was controlled for brood size and age of nestlings by taking their residuals from linear regressions. Box plots show the median (thick line), interquartile range (box) and the range of data (whiskers); sample sizes (i.e. number of broods) are shown below each box.

