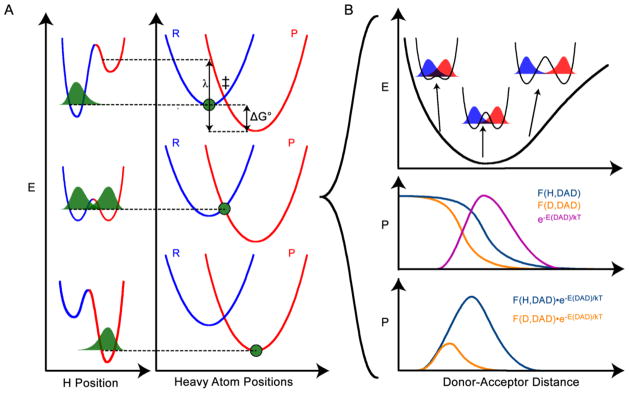
Figure 2.

Marcus-like model of H-tunneling. A) The top, middle, and bottom panels show three stages of the reaction in two designated coordinates: the H position, and the positions of the heavy atoms that modulate the potential surfaces (reactant surface is blue and product surface is red) for the transferred H. In the top panel, the heavy atoms are in a position such that the zero point energy (ZPE) of the H is lower in the reactant well, so the H-wavefunction (green) is localized there. In the middle panel, the heavy atoms have rearranged to a tunneling ready state (TRS, ‡), where the ZPE for the transferred H is equal in the reactant and product wells and the H-wavefunction (including contributions from any motions coupled to the H-position) can tunnel through the barrier. The rate of reaching this tunneling ready state depends on the reaction driving force (ΔG°) and the reorganization energy (λ). In the bottom panel, the heavy atoms have rearranged further, making the ZPE of the product lower than the reactant, and thus trapping the transferred H in the product well. B) At the TRS (middle panel of A) fluctuations of the DAD affect the tunneling probability. The top panel shows a free energy surface for the designated DAD coordinate, indicating the different levels of reactant-product wavefunction overlap at different DADs. At short enough DAD, the ZPE of the transferred particle may be above the barrier, but this leads to very small 1° KIEs and does not appear to be the case for ADH. The middle panel shows the Boltzmann probability distribution of the system being at any given DAD (magenta), along with the tunneling probabilities of H and D as a function of DAD (orange and purple, respectively). The bottom panel shows the product of the Boltzmann factor and the tunneling probability for each particle, yielding the probability of a reactive trajectory as a function of DAD. Panel B illustrates that the reactive trajectories for H and D go through different average DADs, constituting an isotope effect on TRS structure. In ADH, the difference in average DAD for hydride transfer vs. deuteride transfer, which was estimated as 0.2 Å, leads to differences in 2° KIEs when the transferred isotope is different.22
