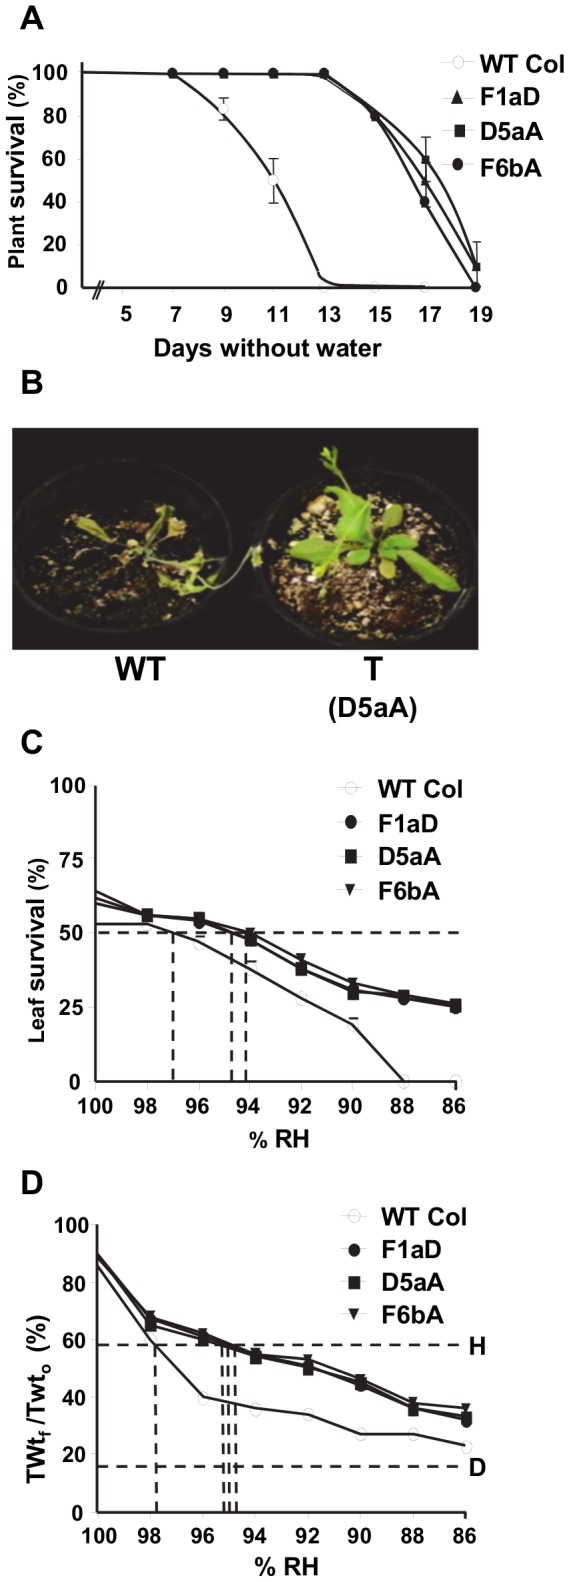
Figure 4. Drought tolerance of SDG8i plants.

(A) Plants were deprived of water, re-watered at intervals and monitored for recovery as described in the text. Values are the means ± SE of 2 replicates.
(B) Wild-type Col-0 (WT) and a transgenic plant (T) after 13 days without water.
(C) Leaf survival and (D) PDT survival curve [% of final saturation weight to the initial turgid weight ratio] showing the effect of decreasing relative humidity on cell survival of SDG8i and WT shoots. PDT value is the water potential (expressed as the corresponding equilibrium relative humidity at 20°C) at which 50% of cells are dead after 3 days vapor equilibration over CaCl2 osmotica. Line D represents the lowest value of TWtf/TWt0 reached by comparable shoots killed by chloroform vapor. Line H is the 50% survival point halfway between line D and 100% TWtf /TWt0.
