
Figure 1. Biochemical and metabolic spectra in the visual cortex.
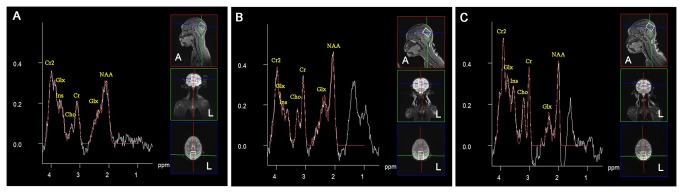
1H-MRS spectra were obtained from the visual cortex of normal control macaque monkeys in group A (A) and sixteen months after binocular visual deprivation in monkey 3 (B) and monkey 4 (C) in group B. The peak area of NAA and the NAA/Cr ratio in the visual cortex of monkey 4 in group B were found to be dramatically decreased, while the peak area of NAA slightly decreased and the NAA/Cr ratio clearly decreased in visual cortex of monkey 3 in group B than those in group A. The Ins/Cr ratio of monkey 4 slightly increased. The peak area of Cho and the Cho/Cr ratio in the visual cortex of all monkeys in group B dramatically increased. The peak area of Glx in the visual cortices of all monkeys in group B slightly increased compared with group A. NAA: N-acetyl aspartate, Cho: choline, Cr: creatine, Glx: glutamate + glutamine, Ins: myo-inositol.