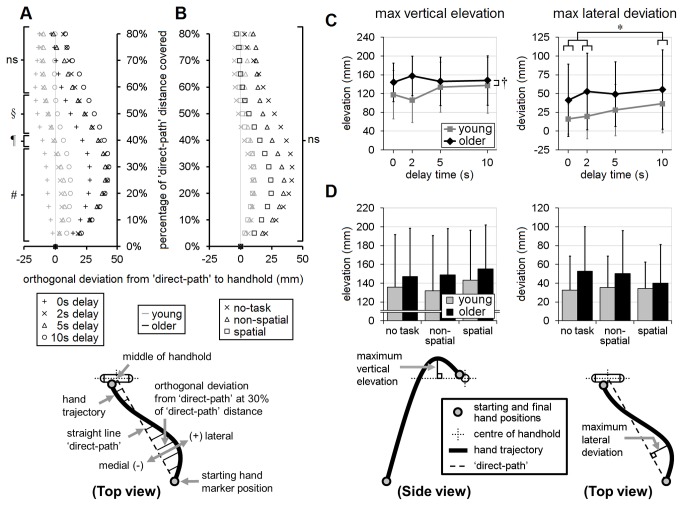
Figure 6. Hand trajectory and maximum hand displacement.
Effects of recall-delay and cognitive-task on mean hand trajectory (A and B, respectively) and on maximum hand displacement (C and D, respectively) are shown in these figures. Means and standard deviations are shown for young adults (gray) and older adults (black); whiskers in panels (C) and (D) indicate standard deviations. The trajectories and maximum lateral hand displacement are defined relative to the “direct-path” connecting the starting hand position and the center of the handhold in the transverse plane (see inset schematic drawings). Panels (A) and (B) illustrate: (1) the tendency of older adults to transport the hand along a more curvilinear and lateral trajectory; (2) the tendency (in both age groups) for lateral hand excursion to increase with increasing recall-delay time (DT); and (3) the lack of any significant cognitive-task effect on hand trajectory [DT=0s significantly different from DT=2-10s (#); DT=0s significantly different from DT=5-10s (¶); DT=0s significantly different from DT=10s (§); no significant differences between means (ns)]. Panel (C) illustrates: (1) a significant effect of recall-delay (*) on maximum lateral hand deviation (further supporting the trends seen in the trajectory plots); and (2) a significant age×recall-delay interaction (†) in maximum vertical hand elevation (suggesting a more consistent tendency for older adults to raise the hand equally high across all recall-delay conditions). [Note: the data were expressed as a proportion of body height in the analyses to reduce variation related to differences in body size; however, the data are shown here in mm to make it easier to interpret the magnitude of the differences in hand displacement].

