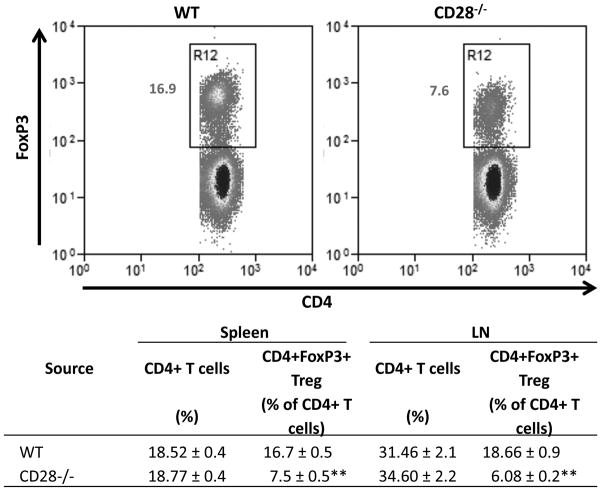
Figure 1.
CD28−/− NOD.H-2h4 mice have fewer Treg than WT NOD.H-2h4 mice. CD4+FoxP3+ cells in spleens and lymph nodes of WT and CD28−/− NOD.H-2h4 mice were determined by flow cytometry. Dot plots of representative mice from each group indicating the percentages of splenic CD4+ cells that express FoxP3 are shown (top). Data are shown as mean ± SEM of N = 6(Spleen B−/− and CD28−/−B−/−) and 3(LN B−/− and CD28−/−) per group and are pooled from 2 experiments. ** p<0.01 compared with respective control CD28+ group, Student’s t-test.

