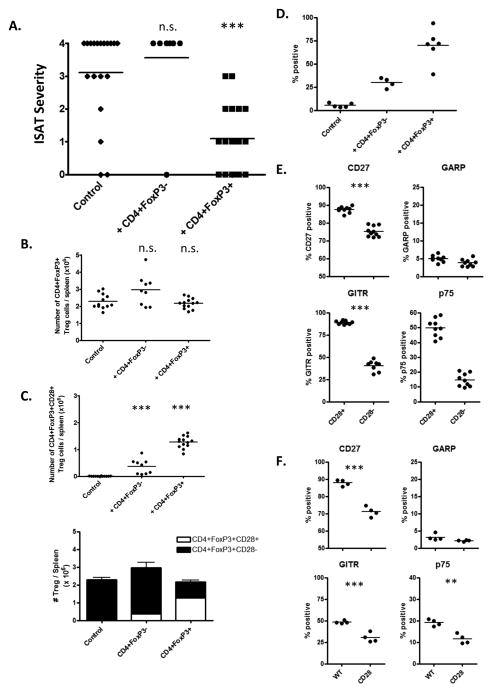
Figure 4.
CD28+/+ Treg suppress ISAT development in CD28−/− mice. (A) CD28−/− mice were given three i.v. injections of 106 sorted CD4+FoxP3+ Treg or CD4+FoxP3− T cells from CD28+/+ FoxP3−GFP NOD.H-2h4 mice as described in Methods. Mice were given NaI in their drinking water at the time of the first injection of Treg, and ISAT severity was determined 7 wks later. N = 19(Control), 9(+ CD4+FoxP3−), and 20 (+ CD4+FoxP3+) mice per group pooled from 3 experiments. *** p < 0.001, Mann-Whitney nonparametric test. (B, C) Splenocytes from CD4+FoxP3+ Treg, CD4+FoxP3− T cell recipients and control mice were stained for expression of CD4, CD28, and FoxP3. Plots represent the total number of CD4+FoxP3+ Treg (B) or CD4+FoxP3+CD28+ Treg (C) per spleen. Bar graph represents total of CD28−CD4+FoxP3+ and CD28+CD4+FoxP3+ Treg per recipient. N = 12(Control), 9(+ CD4+FoxP3−) and 13(+ CD4+FoxP3+) mice per group pooled from 2 independent experiments. (D) Thyroids from the Treg groups in A–C were stained for expression of CD45, CD4, FoxP3, and CD28 and analyzed by flow cytometry. Plots represent the percentage of CD45+CD4+FoxP3+ cells that express CD28. N = 5(Control), 4(+ CD4+FoxP3−) and 6(+ CD4+FoxP3+) mice per group and are representative of 3 independent experiments) (E) Splenocytes from CD4+FoxP3+ Treg recipients were stained for the presence of CD4, CD28, FoxP3 and CD27, GARP, GITR, or TNFR2 p75. Plots represent the percentage of CD28+CD4+FoxP3+CD28+ or CD28−CD4+FoxP3+ cells positive for the indicated marker. (N=9 mice per group; representative of 3 independent experiments.) (F) Splenocytes from WT or CD28−/− mice given NaI water for 8 wks were stained for the presence of CD4, CD28, FoxP3 and CD27, GARP, GITR, or TNFR2 p75. Plots represent the percentage of CD4+FoxP3+ cells positive for the indicated marker. (N=4 mice per group and are representative of 2 independent experiments) n.s. = not significant, ** p < 0.01; *** p < 0.001, Student’s t-test.

