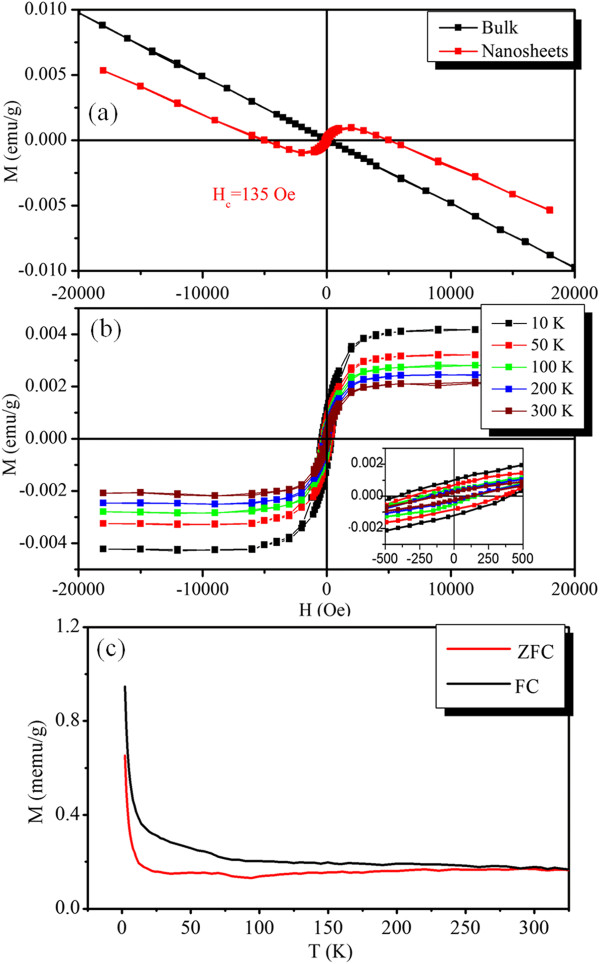
Figure 4.

M-H curves for pristine WS2 bulk and nanosheets and FC and ZFC curves for WS2 nanosheets. (a) The M-H curves for the pristine WS2 bulk and the WS2 nanosheets. (b) M-H curves for the WS2 nanosheets measured at different temperatures, where the diamagnetic signal has been deduced. (c) The FC and ZFC curves for the WS2 nanosheets.
