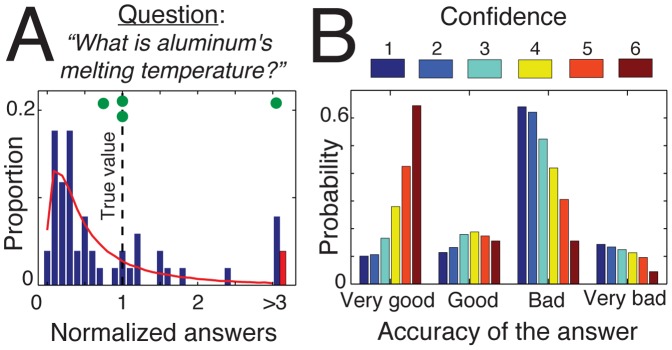
Figure 1. The initial configuration of the system in the absence of social influence.

(A) Initial distribution of opinions for one representative example question (see Fig. S1 for an overview of all 32 items). The normalized answer corresponds to the estimate of the participants divided by the true value (i.e., 660°C for this question). The red curve shows the best fit of a lognormal distribution. The green dots at the top indicate the location of estimates associated with high confidence levels ( ). One of them constitutes an outlier. (B) Accuracy of participants’ answers as a function of their confidence level, as determined from the complete dataset (32 items).
